

In prior updates we had spoken at length about the inherent risks of overreaching for yield and the potential impact reaching for yield can have on a portfolio’s capital value. However, whilst the last 5 years have not been particularly kind to income investors, neither have they been especially unkind and many of our concerns were based on our investment theories rather than a realised outcome.
Unfortunately for many income investors, the ongoing coronavirus period has highlighted in a fairly brutal fashion the damage reaching for yield can have on the performance of equities, fixed income and, inevitably, multi asset portfolios.
To clarify, we classify reaching for yield as focusing on assets (or a combination of assets) where the yield appears higher than that which seems reasonable, without disproportionately increasing risk, and this is often qualified as being circa 4%. This target has remained largely unmoved throughout my career despite ever decreasing yields and global interest rates.
Income producing equities have underperformed worldwide
Within the equity space, the performance difference between income/dividend paying assets and the wider sector is extremely stark. The chart below demonstrates the Performance of the IA Equity sectors against their constituent ‘income funds’. In every geography the average income fund has significantly underperformed the wider sector and produced negative returns for the year. In the case of European, Global, Asian and US equities this negative return was produced in an environment where the wider sector produced positive returns.
1 Year Equity Performance to 30/06/2020
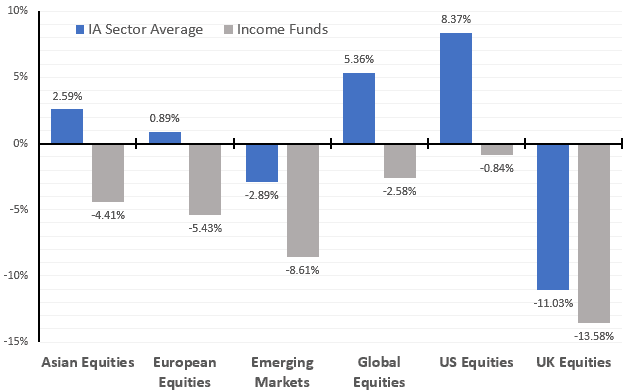
Past performance is not a guide to future performance.
Source of data: FE Analytics
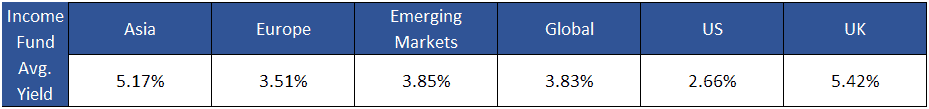
The underperformance of all income producing equities is self-evident, however things are worse when you consider the asset allocation of investors looking to achieve a yield of above 4%. The table above outlines the average yield of equity income funds per geography. Interestingly, there are only two geographies producing a yield of above 4% – Asia & the much-maligned UK. For many income investors, a significant allocation to Asian equities is considered too high risk and as such income portfolios are often primarily populated with UK equity income funds to boost yield. This factor alone has contributed to a significant loss of capital for many less diversified income portfolios as UK equity income funds have seen a capital loss of 13.5% having failed to rerate as significantly as the wider market following the market fall. A collection of, almost, household name UK equity income funds also appears to give some investors a degree of comfort and reassurance which we always felt was rather misplaced. To put it bluntly, the investment approach of holding several funds with the same narrow breadth of high dividend paying stocks was always, and has proven to be, fraught with danger.
Higher yielding bonds have underperformed
In the fixed income space, it has been even tougher to produce an income of over 4% with only high yield and emerging market bonds offering the necessary higher yields (see below). However, and much like equities, the more yield offered the larger the drawdowns experienced through the recent crisis. To put this into context the correlation of these higher yielding assets moved close to 1 in an equity sell off.
1 Year Fixed Income Performance & Yield to 30/06/2020
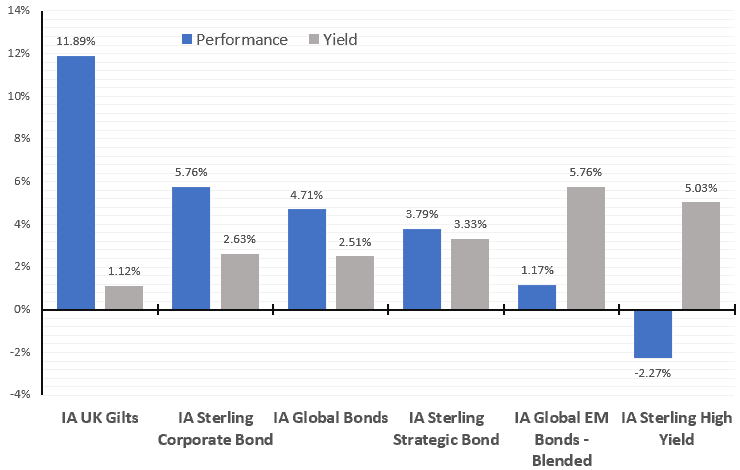
Past performance is not a guide to future performance.
Source of data: FE Analytics
Multi asset income portfolios
Whilst the situation has been unfortunate for many investors looking for investments producing yields of circa 4%, it has been possible to avoid the worst of the drawdowns. By using strategies where the investment approach was more accepting of the super low yield global environment, whilst at the same time avoiding concentration risk.
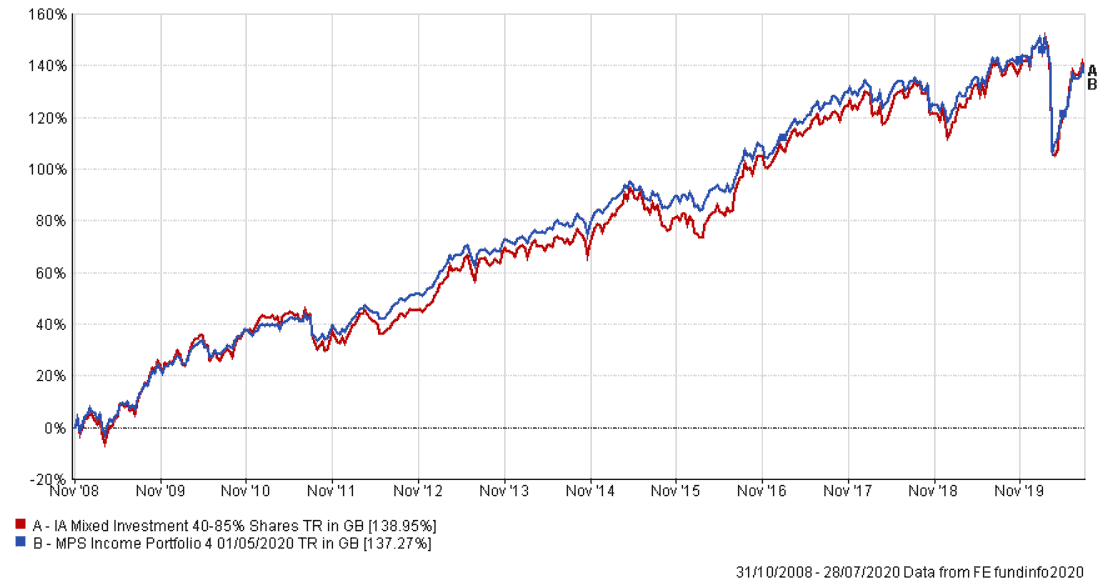
The chart below demonstrates performance against volatility over 3 years and includes all income funds which currently sit within the IA Mixed Investment 40-85% universe. As you would expect, almost all funds with an income remit have underperformed the average, however the range of returns has been wide and those which have fared better have tended to have a lower than average income. It is worth noting that the two worst performers over the period have yields in excess of 5%.
Performance against Volatility – 3 Years to 30/06/2020
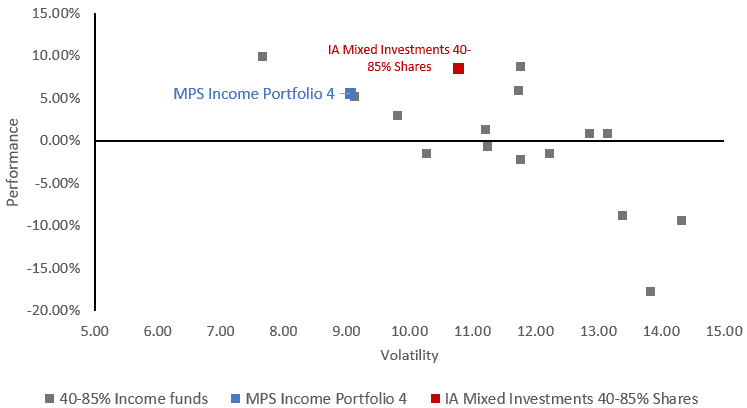
The IBOSS Income MPS range uses simulated past performance data pre-February 2020. Past performance is not a guide to future performance.
Source of data: FE Analytics
This is more easily demonstrated by ordering the funds by yield and reviewing the maximum drawdowns. This is of course affected by asset allocation, fund selection and other factors but the correlation between higher yields and larger drawdowns is clear to see.
Average Historic Yield & Drawdown – 1 year to 30/06/2020
40-85% Share Income Funds are, in this case, defined as funds containing reference to an income mandate through the use of income, distribution or dividend in the fund name.
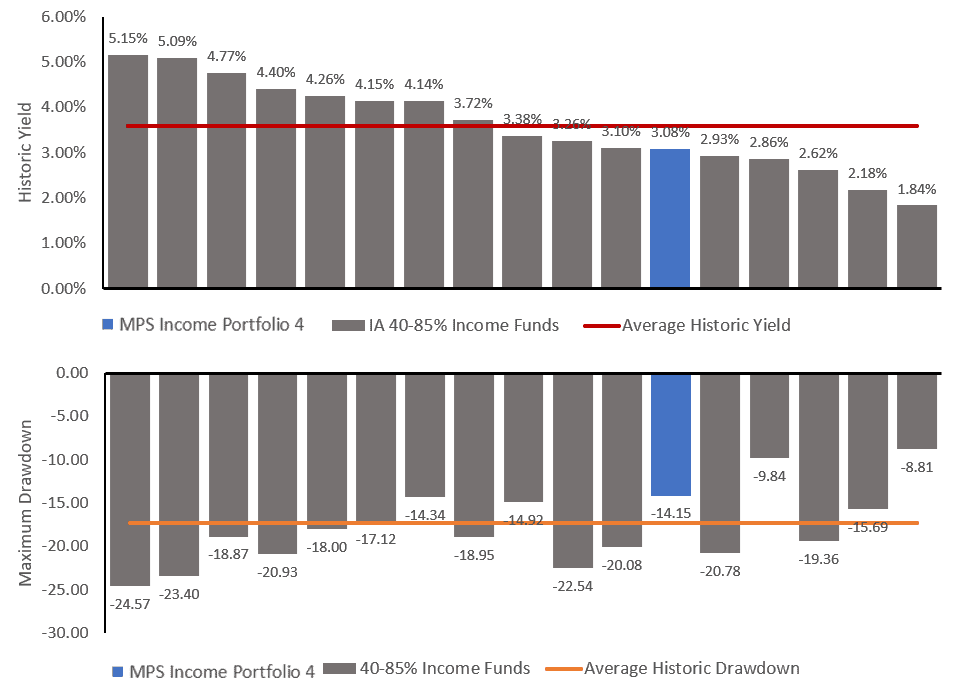
The IBOSS Income MPS range uses simulated past performance data pre-February 2020. Past performance is not a guide to future performance.
Source of data: FE Analytics
Diversification is key
In summary, it has been extremely difficult to put together an income portfolio with a yield of above 4% without severely impacting the overall diversification benefits of a portfolio. It is our view that diversification is an essential part of any portfolio, irrespective of remit. Not only that but diversification is necessary to protect investors from the worst market movements. All points which are evidenced over the recent period and are now reflected with income portfolios over and up to 3 years.
The IBOSS Income MPS range uses simulated past performance data pre-February 2020. Past performance is not a guide to future performance.
Source of data: FE Analytics
This communication is designed for Professional Financial Advisers only and is not approved for direct marketing with individual clients.
Past The Income MPS uses simulated past performance data pre-February 2020. Simulated figures are based on the actual performance figures of the Portfolio Management Service provided by IBOSS Limited.
The MPS range portfolio performance is produced using the preferred share classes, this may differ from platform to platform.
The MPS range is shown net of fund fees only, they do not incorporate platform costs, adviser’s client fee or DFM service charge.
Performance is no guarantee of future performance. The value of an investment and the income from it can fall as well as rise and investors may get back less than they invested. Risk factors should be taken into account and understood including (but not limited to) currency movements, market risk, liquidity risk, concentration risk, lack of certainty risk, inflation risk, performance risk, local market risk and credit risk.
Data is provided by Financial Express (FE). Care has been taken to ensure that the information is correct but FE neither warrants, neither represents nor guarantees the contents of the information, nor does it accept any responsibility for errors, inaccuracies, omissions or any inconsistencies herein. Please note FE data should only be given to retail clients if the IFA firm has the relevant licence with FE.
IAM 204.7.20