
This update covers the period up to August 7th. It primarily covers 2025, but we have extended it back to November 5, 2024, to encompass the entirety of Trump’s second presidency.
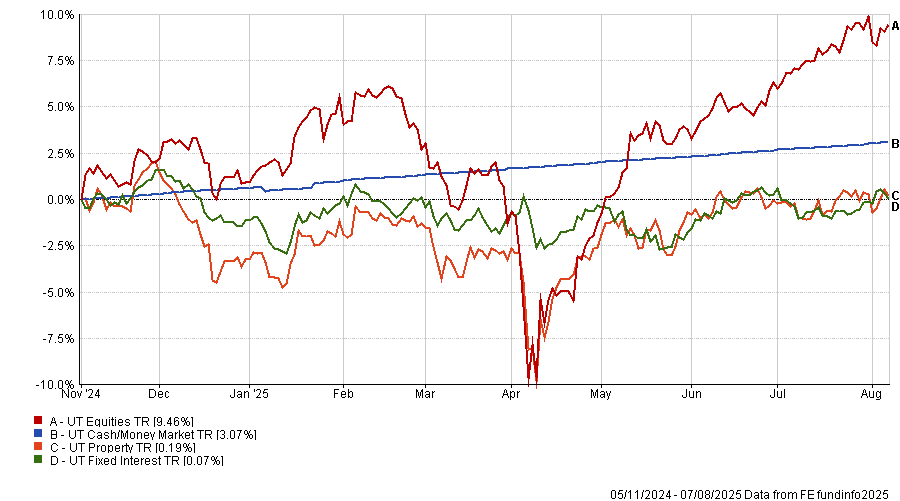
As usual, we use the basic asset classes as a proxy for the broader markets (fig.1). Those more familiar with IBOSS will have often heard us talk of ‘key dates’ which signify market, geographic or sector inflexion points. Approximately three weeks after his election win, it became clear that the tariff situation would be much messier, more complex, and less conclusive than many investors had hoped for. It has since been argued that it also definitively ended the period of peak globalisation.
Asset Class Performance – 05/11/2024 – 07/08/2025 (fig.1)
Macro & Markets
Shiny Happy Investors
July was another particularly positive month for investors, with the majority of asset classes posting gains. Equities rallied over 3% for the month, leaving markets more than 21% higher since the lows of Liberation Day in early April. It will come as no surprise, then, that investors are feeling especially upbeat despite the myriad of geopolitical headwinds dominating the headlines. A point highlighted by a dramatic increase in speculative traders through July.
It’s always worth remembering that the economy is not the same as the market. While the two are linked, it is entirely possible to experience more challenging economic conditions alongside rising stock markets. As such, we have looked to focus on the market outcome rather than focus too heavily on geopolitics. For those more interested, our Chief Economist, Rupert Thompson, writes a weekly update, click here to read the latest update.
Ex-American Exceptionalism
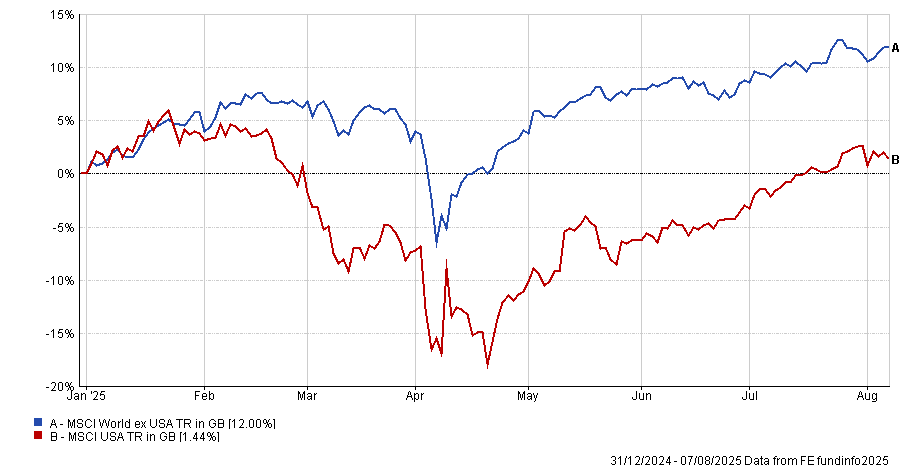
Fig.2 is a chart we’ve included in various presentations and updates over recent months, but it perhaps best puts into perspective the journey of an average equity investor this year. Equity investors have been rewarded for holding a more diverse range of regions, with the rest of the world up 12% versus the US up only 1.44%, in sterling terms.
As the chart shows, US assets have staged a remarkable rebound, having been down more than 15% at one point. They have since rallied 22% from the Liberation Day lows. The rest of the world has also enjoyed a strong recovery, climbing 20% over the same period.
Long story short, diversification has paid handsomely this year in both falling and rising markets.
US Equities vs The Rest of the world – Year to date to 07/08/2025 (fig.2)
We’ve spoken at length about the impact of Trump’s policies on stock markets this year, but one point we believe is being underestimated is how his more aggressive stance is being received by international governments behind closed doors. While many countries appear to be ceding ground to Trump in public, we contend that efforts are quietly underway to distance themselves from a regime that has proven, at the very least, an unreliable trading partner.
Even though some tariff rates are being negotiated downward, they remain substantially elevated compared to what many of us have become accustomed to. The average US import tariff now sits around 18 to 19 percent, the highest since the 1930s. Some countries’ rates are even steeper, with Canada and Switzerland facing hikes up to 35 to 39 percent. Those levels are well beyond historical norms, and although the full economic and market impacts remain uncertain, they’re unlikely to be insignificant.
From woes to wows in Emerging Markets
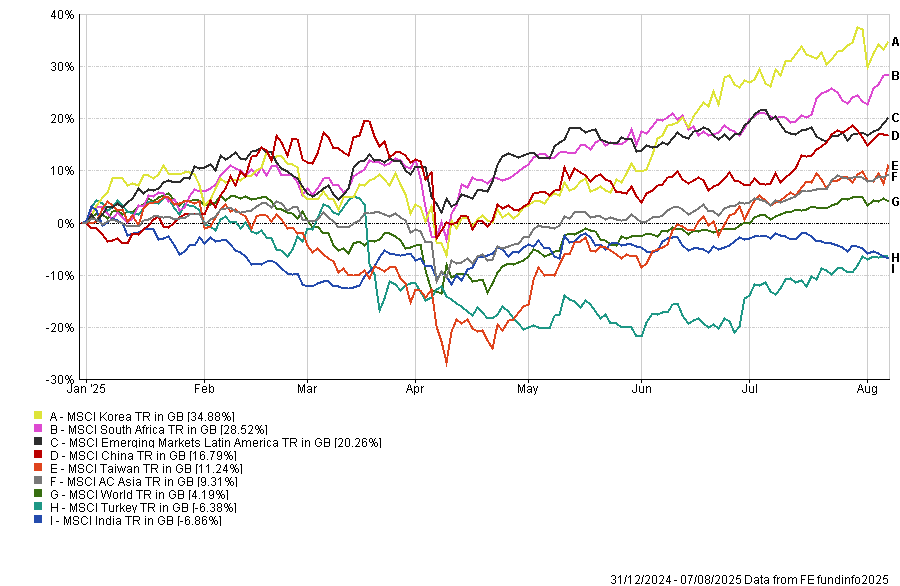
Perhaps an unlikely winner this year has been many areas of emerging markets (fig.3). Standout performers include South Korea (35 percent), South Africa (29 percent), and Latin America (20 percent), where returns have far exceeded those of the rest of the world. Each of these regions has been under-owned in recent years, but even a small allocation could have added significantly to overall outperformance.
Unsurprisingly, the region’s most in the line of fire from Trump’s policies have been China and more recently, India. As the chart below shows, China has held up reasonably well, with a return of almost 17 percent this year. Conversely, India’s returns have been negative for the year. However, unlike much of emerging markets, India has been one of the few geographies to match the US in returns over recent years. This recent shift could therefore reflect a broadening of the emerging market investor base, much like the trend we’ve seen among investors in developed markets, who have started to diversify their regional exposure.
Global Emerging Market Performance – Year to date to 07/08/2025 (fig.3)
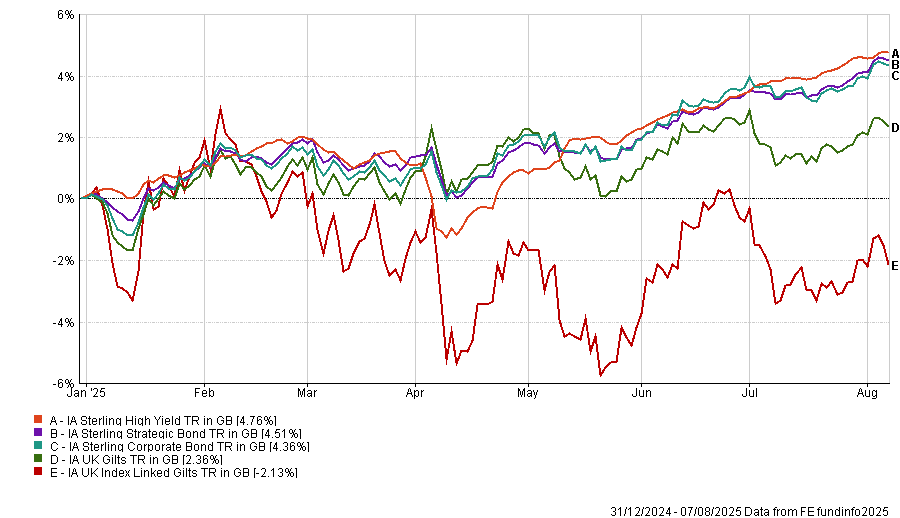
Fixed Income Rallies
Fixed income assets have also experienced a shift in fortunes over recent months, something that may not be fully captured in fig,1. As you’ll see below in fig.4, aside from index-linked bonds, many fixed income indices have posted marked gains this year. This capital growth, combined with some impressive yields, means that lower-risk investors who typically hold a larger allocation to fixed income have enjoyed some welcome positive news from this part of their portfolio.
One point worth highlighting is that actively managed fixed income assets have performed particularly well this year. We have long maintained that the fixed income environment is likely to remain volatile going forward. This volatility, paired with higher yields, creates an especially attractive setting for active managers who can both harvest yield and trade volatility even if overall yields or interest rates don’t see significant changes.
Fixed Income – Year to date to 07/08/2025 (fig.4)
Performance & Positioning
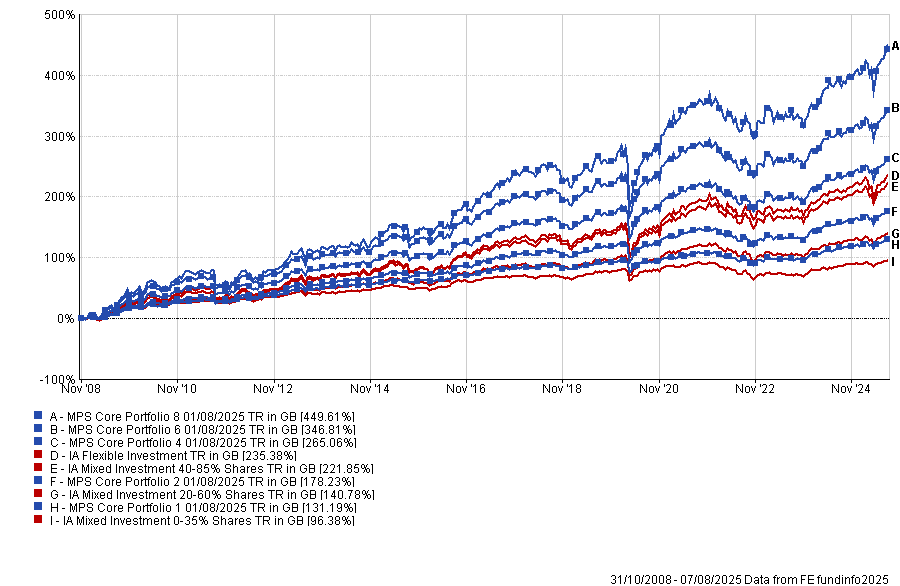
The IBOSS portfolios continue to perform well throughout the year, with all Core and Decumulation portfolios outperforming year-to-date, and the Passive range outperforming in 8 out of 9 cases. Of particular note is the strong performance of our higher-risk portfolios, which have delivered considerable outperformance relative to their respective benchmarks.
We have often said that diversification and lower volatility do not necessarily mean lower returns a point perhaps best illustrated by the standout results from the higher-risk portfolios. Portfolio 8 has returned over 10% this year and has nearly doubled the returns of its benchmark since launch (see chart below).
While asset allocation especially within the equity portion of the portfolio has been a key driver of this performance, fund selection has been equally important. This year has seen a wide dispersion of returns between the best and worst performing funds, and our team has successfully generated alpha by selecting managers who have adeptly navigated the changing market conditions.
We expect the current market dynamics of higher volatility and increased differentiation of returns between asset classes and regions to persist. In such an environment, where market outcomes remain largely unpredictable, we believe diversification is more essential than ever not only to protect clients from the worst market downturns but also to position them to seize a broader range of opportunities.
IBOSS Core Portfolio Performance – Start of Data – 31/10/2008 – 07/08/2025
This communication is designed for professional financial advisers only and is not approved for direct marketing with individual clients. These investments are not suitable for everyone, and you should obtain expert advice from a professional financial adviser. Investments are intended to be held over a medium to long term timescale, taking into account the minimum period of time designated by the risk rating of the particular fund or portfolio, although this does not provide any guarantee that your objectives will be met. Please note that the content is based on the author’s opinion and is not intended as investment advice. It remains the responsibility of the financial adviser to verify the accuracy of the information and assess whether the OEIC fund or discretionary fund management model portfolio is suitable and appropriate for their customer.
Past performance is not a reliable indicator of future performance. The value of investments and the income derived from them can fall as well as rise, and investors may get back less than they invested.
IBOSS Asset Management Limited is authorised and regulated by the Financial Conduct Authority. Financial Services Register Number 697866.
IBOSS Asset Management Limited is owned by Kingswood Holdings Limited, incorporated in Guernsey (registered number: 42316).
Registered Office is: 2 Sceptre House, Hornbeam Square North, Harrogate, HG2 8PB. Registered in England No: 6427223.
IAM 234.8.25