
In the last few days, we have had a glimpse of the next market moves. Still, at the moment, there is insufficient evidence to say with any confidence that we have entered a new period and brought an end to the central bank-induced volatility.
The charts in this update do not include the significant moves in government bonds and equities, especially small and mid-caps, which moved dramatically after a slightly better-than-forecast inflation print in the US. Within hours, Ark Investment’s Cathie Wood was once again wheeled out to pronounce the Fed is wrong and rates need to be much lower. Needless to say, she is talking her own book and has been wrong now for the best part of three years, so she does at least have that in common with the Fed.
For balance, we have other luminaries, such as JP Morgan’s Jamie Dimon, saying the Fed may still need to do more. This is also possible, but we should remember he told us in August 2018 “to prepare to deal with rates at 5% or higher.” At the time, rates were 2.95%, but rather than move up to 5%, they dropped to 0.5% over the next two years. Mr Dimon was eventually right, but just five years early. Our takeaway from the various calls made over time is that nothing is certain, no matter how big your research team is, which is why we continue to diversify across the assets and within the sectors.
Equities
We are now approaching two years since Fed Chair Powell’s inflation epiphany. The chart (fig.1) shows how some of the different regions and countries have fared in the period that saw the developed world central banks floundering around trying to work out how the years of their quantitative easing (QE) and super low interest rates would play out.
Global Equity Performance – 01/12/2021 to 13/11/2023 (fig 1) *
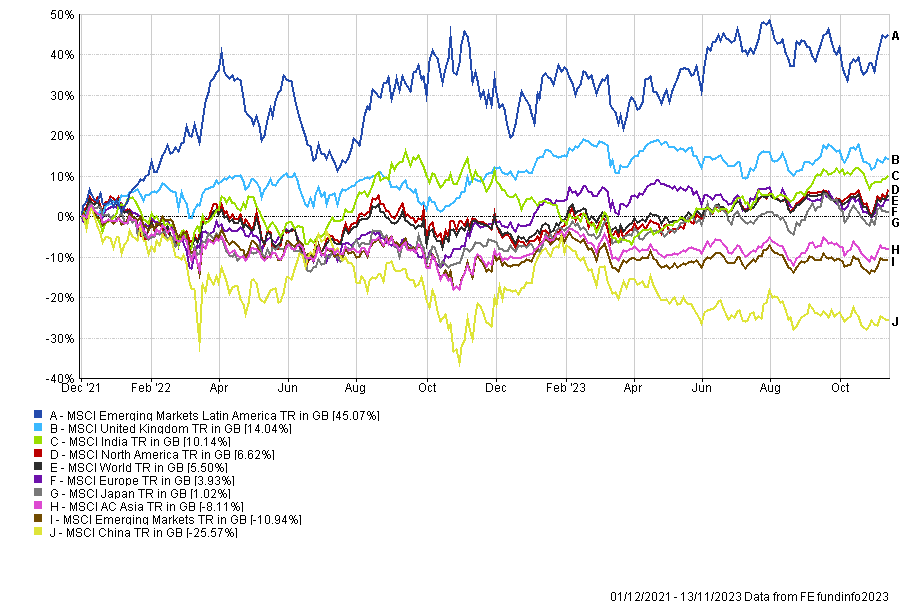
Contrary to what many people might think, Latin America, India, and the “good old” UK have been the best performers, with Asia and particularly China bringing up the rear. Despite this outperformance, we still think there are strong investment cases for all three of the winners from the last two years.
Latin America is a beneficiary of the deglobalisation and reshoring, India has good demographics and economic growth, and is attracting the kinds of courtship that China can currently only dream about. The UK, which surely is only beaten by China and North Korea in terms of PR missteps, still has much going for it. In the era of ESG, it is worth pointing out that the UK still tops the table for corporate governance and from a valuation perspective, our small and mid-cap companies have gone through a torrid time in recent years and valuations look more attractive than they have for some time and, by some metrics, more attractive than ever before.
Fixed Income
The world of fixed income is meant to be more prosaic compared to the excitement of equities, but the realisation by central banks that inflation was a thing has meant it’s been anything but peaceful. In fact, parts of the bond markets have been horrific, as the chart below (fig.2) highlights.
Global Fixed Income Performance – 01/12/2021 to 13/11/2023 (fig 2) *
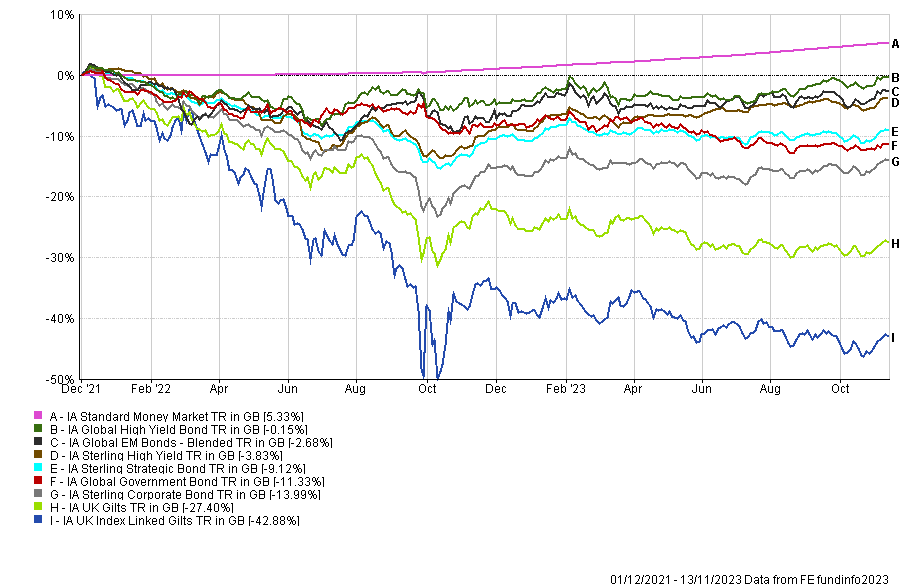
In stark contrast to equity returns, the last place you wanted to be was UK sovereign bonds, index-linked or not, but virtually nothing has made money over the last two years. A cause for minor celebration was if you managed to minimise the losses compared to peers, but clients can hardly be expected to thank you.
We often highlight the dangers of using the rearview mirror as an investment tool, and bonds could be the latest example of an asset many have abandoned just when the greatest return might be achieved. What is unarguable is that compared to the dizzying lows sovereign bond yields reached back in 2021, the entry price is more attractive across the whole fixed income complex, except for high yield.
After a batch of data showing inflation might have been reined in, at least for now, we should expect continued outsized moves in the bond market. This volatility, instead of bond prices grinding lower, presents a real opportunity for active bond managers. This is why we have been increasing our allocation to them. Our stable of managers consists of the teams from M&G, JPM, Rathbone and L&G. The reason for using multiple managers is that we expect performance to be lumpy but positive, but we also want a relatively smooth journey for our clients.
Outlook
As we head to 2024, we should remind ourselves of how markets look compared to the start of 2022, and we would summarise the situation like this:
The three key components of a client valuation are the starting price of equities, the starting price of bonds and the starting (relative) price of the base currency. If we ex out the largest US tech stocks, then much of the rest of the investable equity universe is not particularly expensive, and some parts, like the UK small-cap, are positively cheap. Bonds in the round are more attractive than they have been for many years. Sterling is trading within a reasonable range against its peers and is no longer the unanchored currency it temporarily became, first post the Brexit vote and then again after the disastrous mini-budget in September 2022. It’s not common to describe cash as expensive, but if we look at it on a relative level to the other available assets, then a case can be made to say just that.
As ever, the siren calls to invest in what worked most recently will continue to be heard.
A New Era?
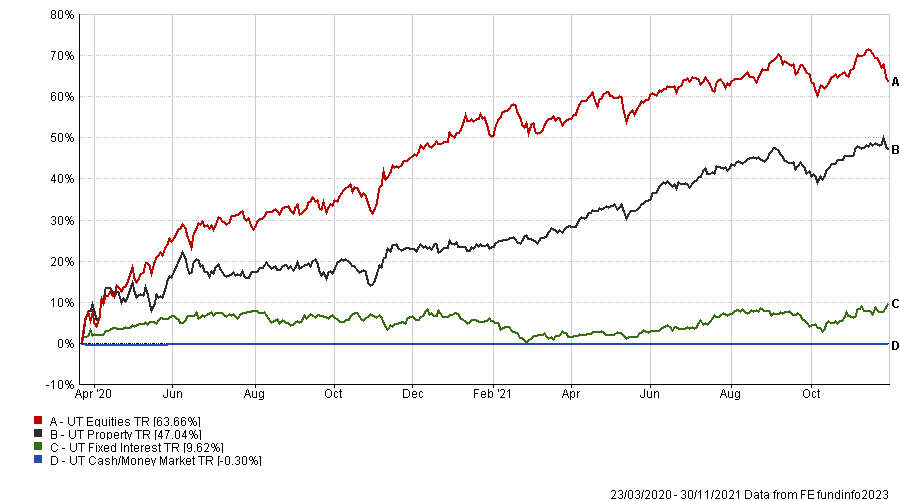
The following charts show two distinct investment eras (fig.3 and fig.4) and the last chart (fig.5) shows what may be the start of a new one.
The economic and macro market backdrop of ‘fig.5’ has little in common with either of the first two eras, so we should expect a different outcome from the available asset classes. Acceptance of what is unknowable dictates that diversification remains both a key driver of longer-term returns and a key safeguard for the journey.
Asset Performance – 23/03/2020 – 30/11/2021 (fig 3) *
Asset Performance – 01/12/2021 – 31/10/2023 (fig 4) *
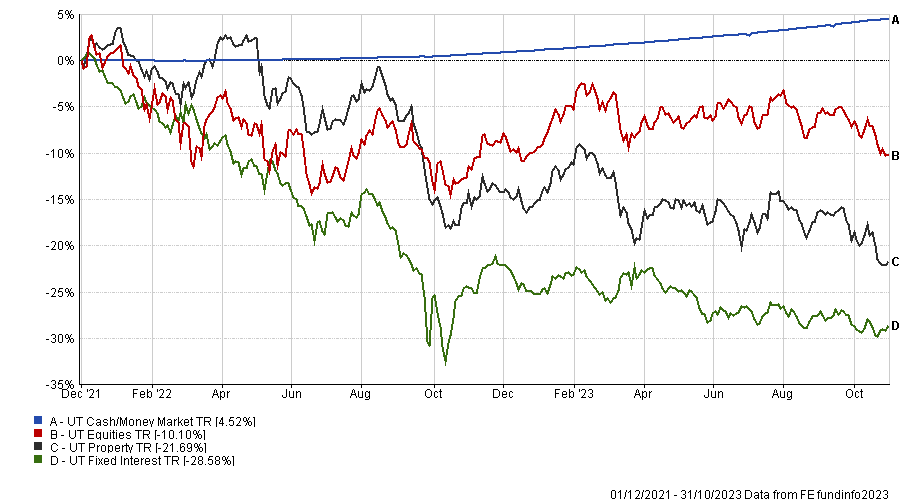
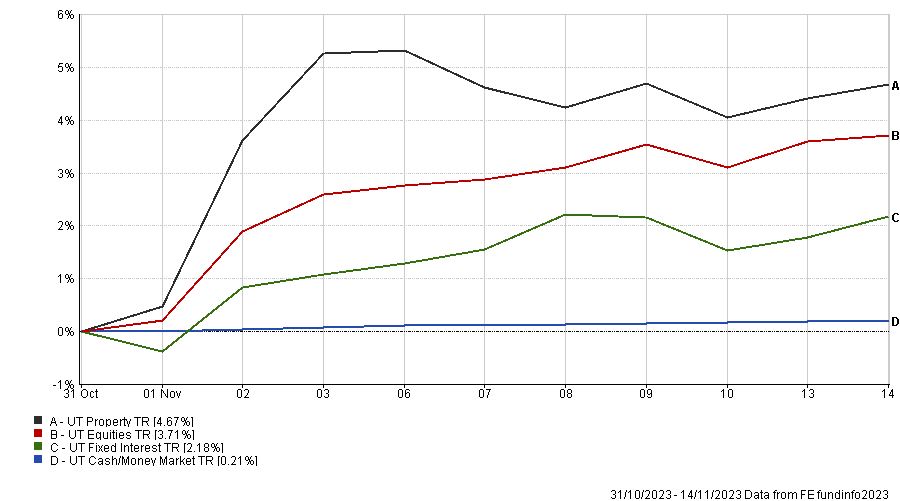
Asset Performance – 31/10/2023 to 14/11/2023 (fig 5) *
Earlier in the week, we released a special market update given the sudden movements in markets and is particularly pertinent in regards to the subject of cash and market timing. You can read this below if you haven’t already…
Market FOMO Dress Rehearsal
“I think the efficacy of the dot plot probably decays over the three-month period between that meeting and the next meeting…; we do personally update our forecast, but we don’t formally update the dot plot.” – Jerome Powell, Chair of the Federal Reserve of the United States (the Fed)
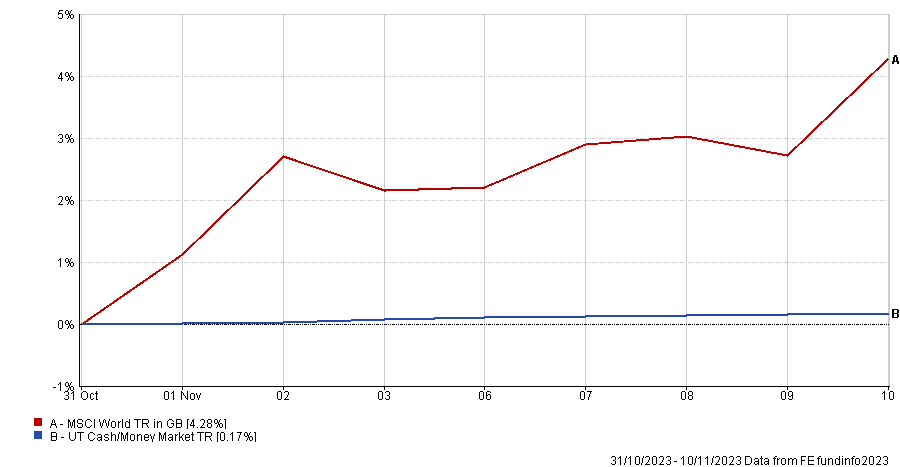
This line from Powell, and others similarly dovish, has been enough to put a fire under risk assets, with global equities rising (fig.6) and bond yields falling since the beginning of the month. Powell was responding to weaker US economic data, but data out of the Eurozone and the UK has been unarguably poorer. So, it seems reasonable to say that in much of the developed world, taking this snapshot in isolation, inflationary pressures have diminished and the need to raise interest rates has abated. It would also seem rational to say that we may have already witnessed peak inflation, but not all the data confirm this point.
MSCI World Vs. Cash/Money Market – Post Fed’s Comments (fig.6)*
However, what interests us here is the market reaction to the Fed’s reaction to the data. Whilst the inflationary data looks more benign, we cannot say with any certainty that we won’t see a further escalation in the coming months, forcing the Fed to stay higher for longer or even increase rates again.
This complete lack of clarity brings us to the subject of cash and market timing.
The recent data events might be for real, and markets continue to increase in value, or it might be a dress rehearsal for when rates start to fall and, in the meantime, markets roll over again. Since even the largest Wall Street banks, with their team of macro strategists, banks of analysts and various other experts, cannot agree on what to infer from the myriad of data that is produced daily, then how can those in less informed positions?
Our point is – that markets move quickly, quicker than ever, and certainly faster than retail clients with or without an adviser can practicably react. So, for those who have fled to cash or are still thinking they should, it is worth giving some time for when, and if, they might want to get back in and what the triggers would be. What is highly unlikely to work is waiting for confirmation it’s safe to go back in the water via the mainstream media. By the time any news is considered sufficiently newsworthy, the markets will have already moved.
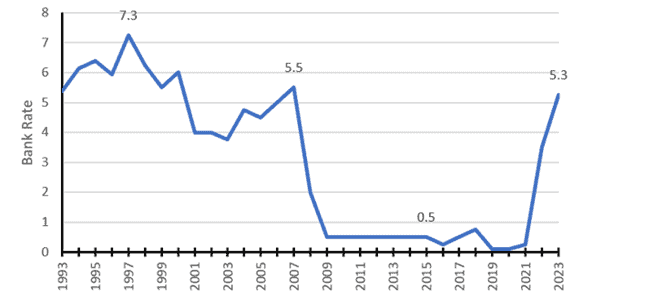
As a separate but connected point, if inflation has peaked and so have interest rates (fig.7), then it would be reasonable to read across from that the highs are in for cash. In recent historical terms and purely relative to risk assets, it could be said that cash is expensive. So, a possible scenario could be that the global economy falters, (cash) rates fall, and bonds and/or equities go up in value.
So, in conclusion, if we do indeed accept how much we cannot know, it would seem to make sense to invest (or stay invested) across the available asset classes. We can know when an asset is cheap or expensive relative to its history and any alternatives, but we cannot know when the asset will re-price or what the exact catalyst will be.
Bank of England Interest Rates 30 Years (fig.7)
*Information is short term in nature to demonstrate performance over a specific time period. Please contact IBOSS for long term data, including since launch and/or 5 years.
This communication is designed for professional financial advisers only and is not approved for direct marketing with individual clients. These investments are not suitable for everyone, and you should obtain expert advice from a professional financial adviser. Investments are intended to be held over a medium to long term timescale, taking into account the minimum period of time designated by the risk rating of the particular fund or portfolio, although this does not provide any guarantee that your objectives will be met. Please note that the content is based on the author’s opinion and is not intended as investment advice. It remains the responsibility of the financial adviser to verify the accuracy of the information and assess whether the OEIC fund or discretionary fund management model portfolio is suitable and appropriate for their customer.
Past performance is not a reliable indicator of future performance. The value of investments and the income derived from them can fall as well as rise, and investors may get back less than they invested.
Data is provided by Financial Express (FE). Care has been taken to ensure that the information is correct but FE neither warrants, neither represents nor guarantees the contents of the information, nor does it accept any responsibility for errors, inaccuracies, omissions or any inconsistencies herein. Please note FE data should only be given to retail clients if the IFA firm has the relevant licence with FE.
IBOSS Asset Management Limited is authorised and regulated by the Financial Conduct Authority. Financial Services Register Number 697866.
IBOSS Asset Management Limited is owned by Kingswood Holdings Limited, an AIM Listed company incorporated in Guernsey (registered number: 42316).
Registered Office is the same: 2 Sceptre House, Hornbeam Square North, Harrogate, HG2 8PB. Registered in England No: 6427223.
IAM 324.11.23