
This update briefly reviews developments in 2025 and the first trading days of 2026, but its primary focus is on our outlook for the remainder of the year. As we have noted many times, one, three, and five-year data points are largely irrelevant to markets, as are calendar years themselves. Likewise, geopolitics and wars rarely influence markets for more than a few days.
What does drive markets are big-picture themes. Today these include the AI trade, Europe’s need to become more realistic and rearm, and underpinning both, the growing shortage of key commodities. To this mix we would also add the gradual move away from US Treasuries and the US dollar. The former has been underway for years; the latter began in earnest during Donald Trump’s second term. Both represent long-term structural trends rather than short-lived, quarter-to-quarter stories.
A further major theme is the growing recognition that being permanently overweight the US, whether including or excluding the large US technology companies, carries significant risk for clients. This reassessment and reallocation have developed relatively quickly in some quarters, particularly outside the US, and is likely to accelerate globally once US investors recognise that the world has moved on from the assumption that, whatever the question, the answer must be a US asset.
MSCI Selected Country Indices 01/01/2025 > 05/01/2026 (Fig.1)
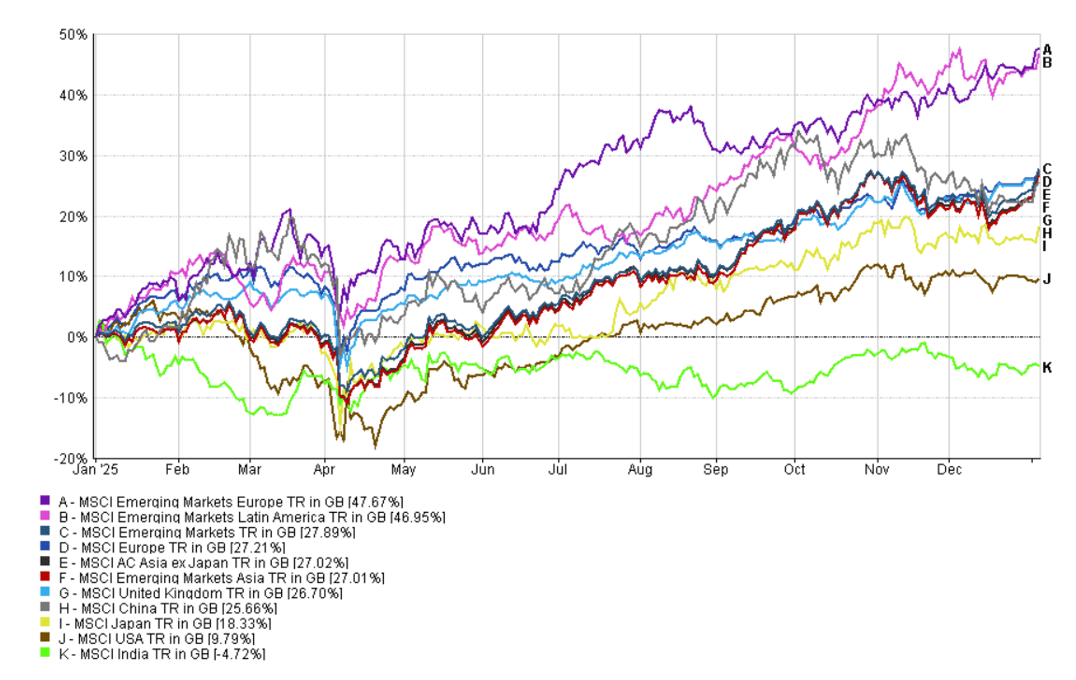
Source: FE Fundinfo
MSCI World Ex USA Vs. USA 01/01/2025 > 05/01/2026 (Fig.2)
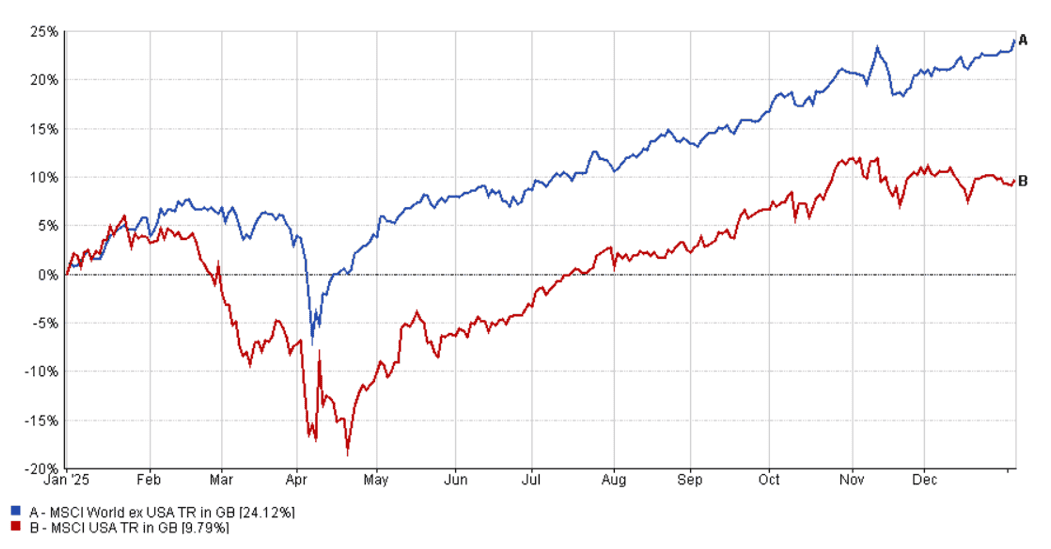
Source: FE Fundinfo
Is anybody safe?
The tentacles of the Trump administration continue to extend geographically. Venezuela is the first country where they explicitly removed the leader, but Trump has questioned the legitimacy of many others and if you have something he wants, you need to tread extremely carefully. Canada, Greenland, Columbia, Mexico, Nigeria, Cuba, the list continues to grow of places he has talked about controlling annexing or just bossing around generally. There are plenty of places where you can read about the relative merits of the Trumpian world order but what we are concerned about here is how does any of this effect markets? The simplest answer is that you need to be diversified but while that might sound simple enough, in reality it is anything but simple.
Benchmarks, Career Risks and Recency Bias
Until the beginning of 2025, UK investors had been steadily increasing their exposure to the US. This applied across retail and institutional investors alike and included the vast majority of MPS providers. Those who chose not to follow the herd most likely underperformed their benchmark. Even with a supportive investor base or board, this often led to sub-optimal outcomes for everyone involved: clients saw lower returns, and investment managers were eventually replaced.
The longer such a narrative persists, the harder it becomes to move away from it, and it is often argued that being early is indistinguishable from being wrong. We believe that for a sustained period, although we cannot attach an exact timeframe, the themes that emerged in 2025, and in particular those following the emergence of DeepSeek, will continue to drive markets. In simple terms, this implies a preference for the world ex-US over the US, but important to note this is on a relative basis.
Market inflection points are often when the best active managers have the greatest opportunity to outperform their passive peers. As a result, we currently favour active management across most asset classes. To illustrate this, Figure 4 shows how our Core proposition has performed relative to its equivalent passive portfolio since the beginning of 2025, when we began to understand the implications of a Trump 2.0 world and DeepSeek’s arrival on the AI stage.
Core Vs Passive Portfolio 4s – Start of Data > 05/01/2026 (Fig.3)
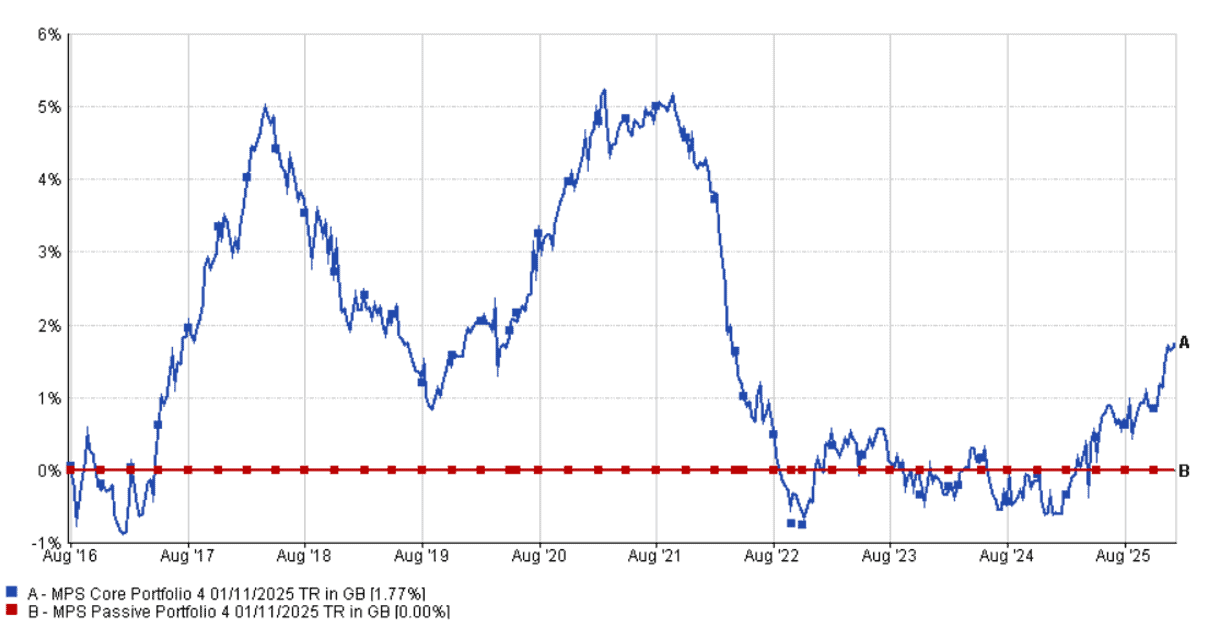
Source: FE Fundinfo
Core Vs Passive Portfolio 4s – 01/01/2025 > 05/01/2026 (Fig.4)
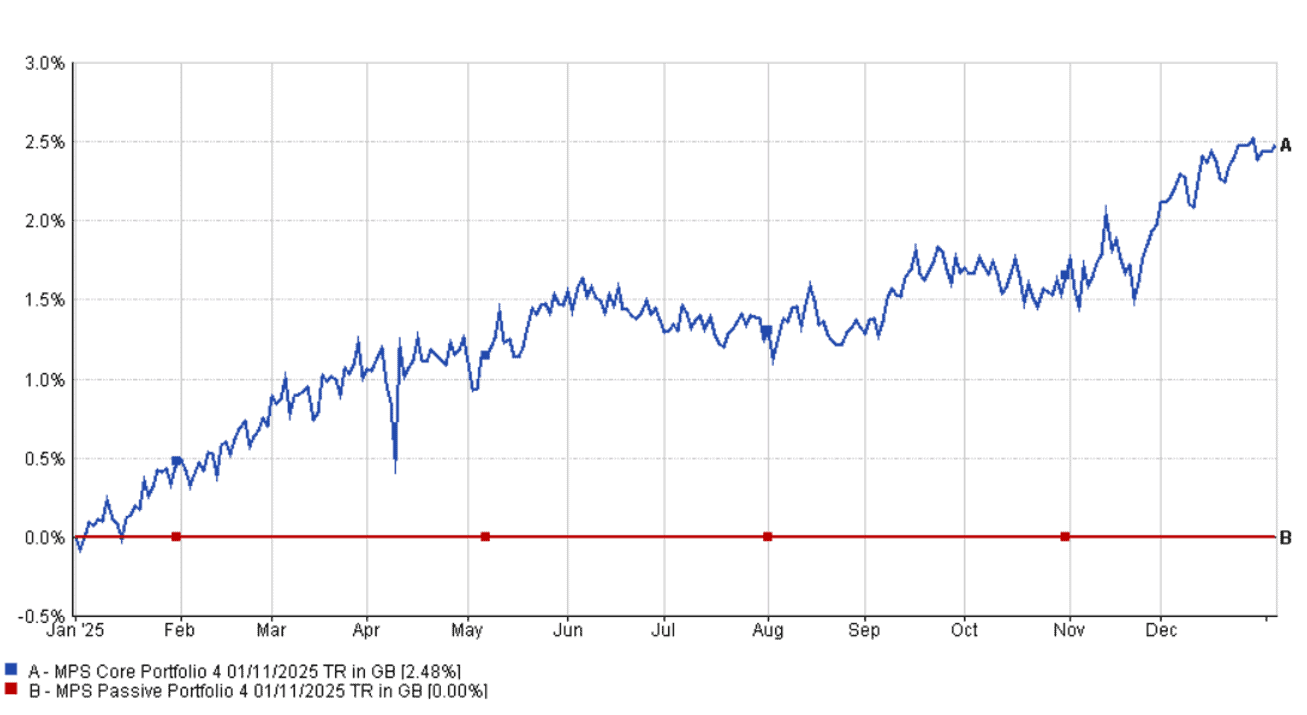
Source: FE Fundinfo
2025 Performance Summary – IBOSS Portfolios
IBOSS Core Portfolios
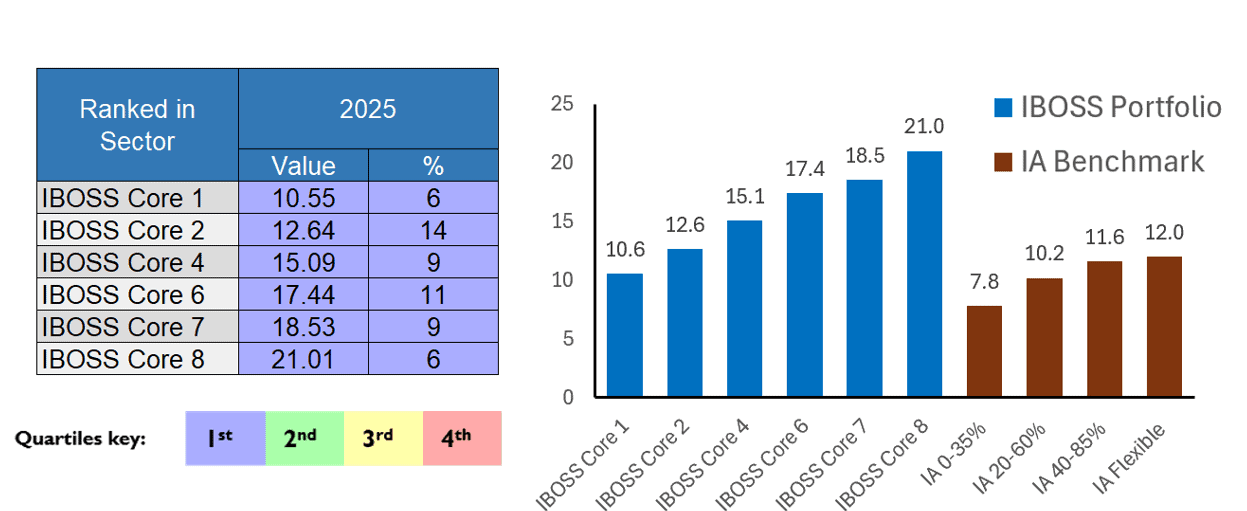
All IBOSS Core portfolios outperformed their respective benchmarks in 2025 by between 3% and 9%. The outperformance reflects the best year in IBOSS history as investors were handsomely rewarded for holding a more diverse range of assets across the risk ratings.
The chart below highlights how each core portfolio has performed against the peer group, with all portfolios ranking in the top 14% of the peer group for the year.
Some key takeaways:
- Core Portfolio 4, which holds the largest proportion of client assets, ranked in the top 9% of multi-asset peers for the year.
- Core Portfolio 8, our highest-risk portfolio, ranked in the top 6% of peers. Demonstrating significant outperforming in a rising market.
2025 – IBOSS Core ranked against IA Peer group
Source: FE Fundinfo
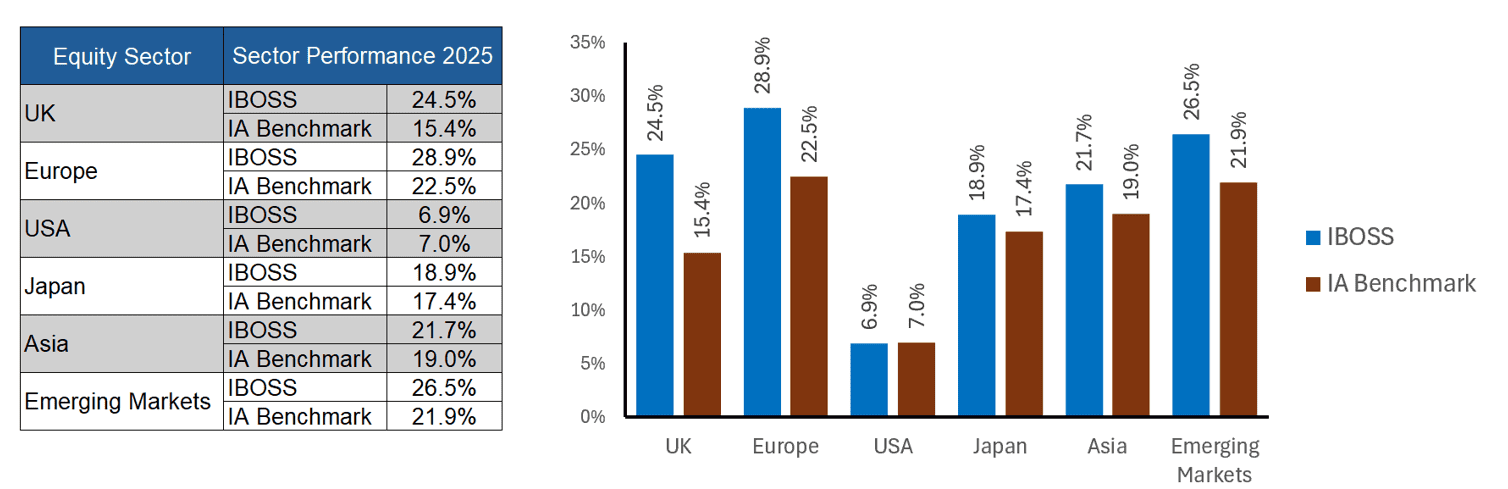
Another key contributor to returns has been fund selection. In 2025, active managers have had ample opportunity to outperform (and underperform) their respective benchmarks. As a result, we have seen a huge difference between the best and worst performing funds across various regions. The chart below highlights the performance of the funds broken down into individual regions through the year.
Some key Takeaways:
- Fund selection on average accounted for an extra 4% returns through the year.
- UK Equities, performed strongly, with IBOSS fund selection generating an additional 9% return versus the broader sector.
- US Equities, underperformed other regions considerably through 2025
2025 – Attribution Analysis – Equities
Source: FE Fundinfo
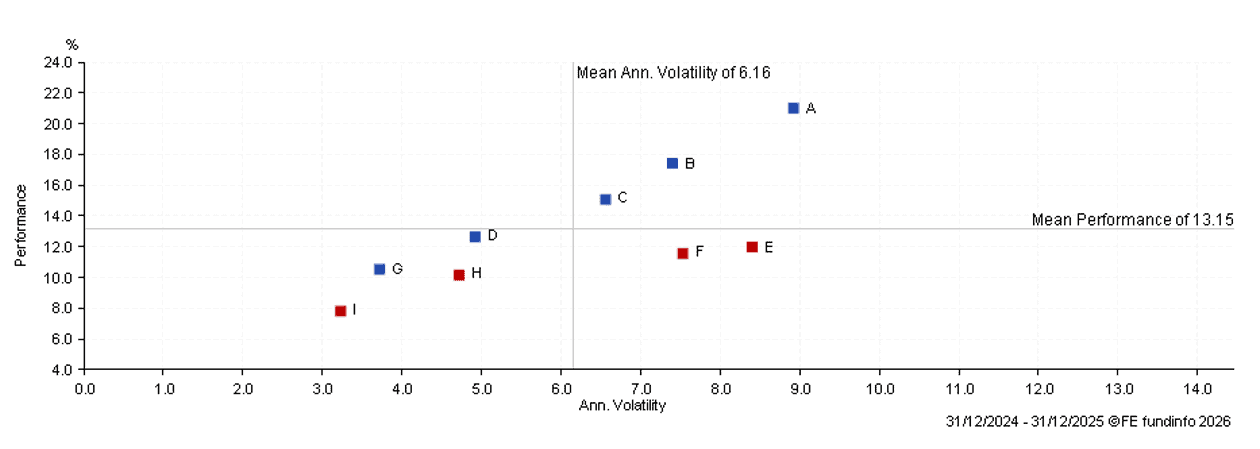
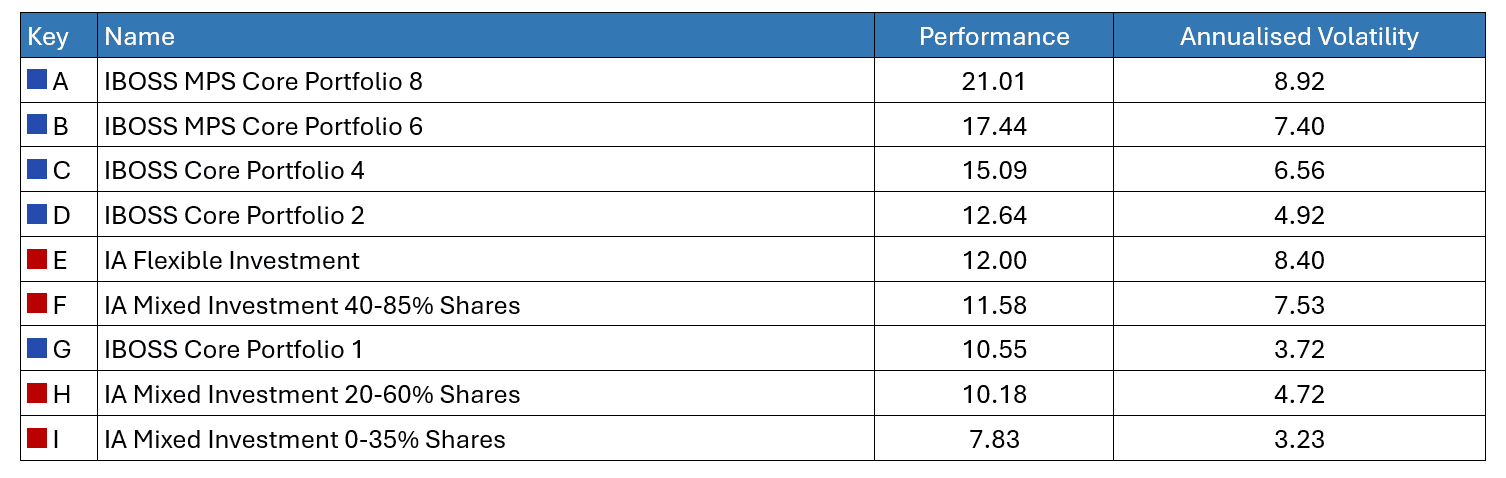
The scatter chart below highlights one-year performance against annualised volatility for IBOSS Core Portfolios compared with IA peer group benchmarks, reinforcing the strength of IBOSS’s risk-adjusted returns, even over this shorter period.
1 Year Scatter – Performance against Volatility – 2025
Source: FE Fundinfo
IBOSS Passive Portfolios
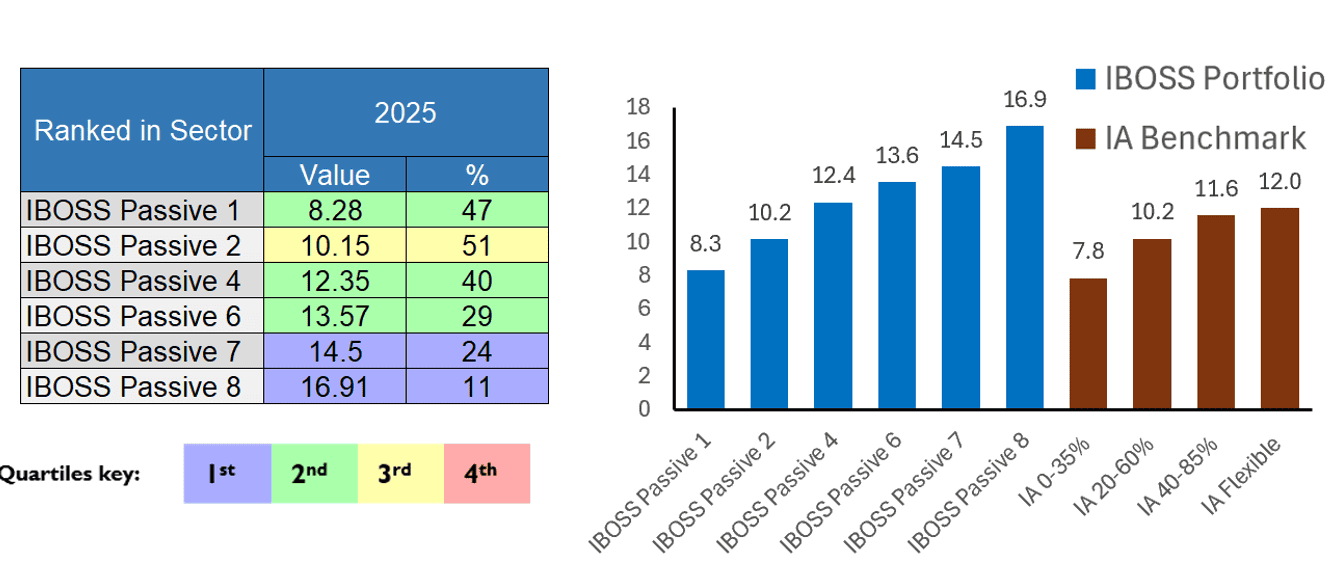
The majority of IBOSS Passive Portfolios outperformed their benchmarks in 2025. While overall outperformance was more muted compared with the Core range, the broader regional diversification within the passive portfolios proved beneficial throughout the year. As a result, the range delivered returns of between 8% and 17% for clients over 2025.
Some key takeaways:
- Lower-risk passive portfolios delivered solid absolute returns but underperformed relative to the Core range. This was largely due to active fixed income managers outperforming their passive equivalents during the year.
- Passive Portfolio 8, the highest-risk portfolio in the range, ranked in the top 11% of peers, demonstrating strong participation in a rising market environment.
2025 – IBOSS Core ranked against IA Peer group
Source: FE Fundinfo
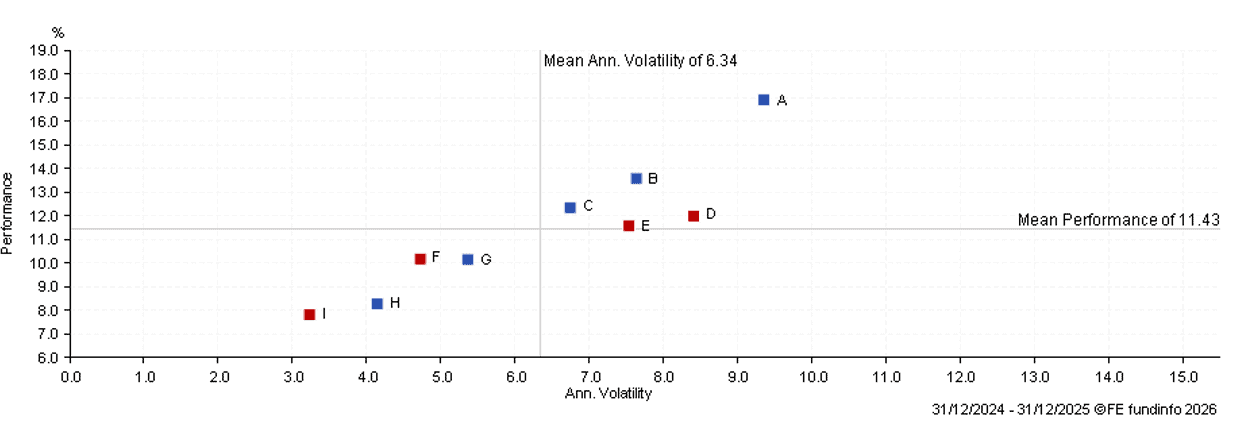
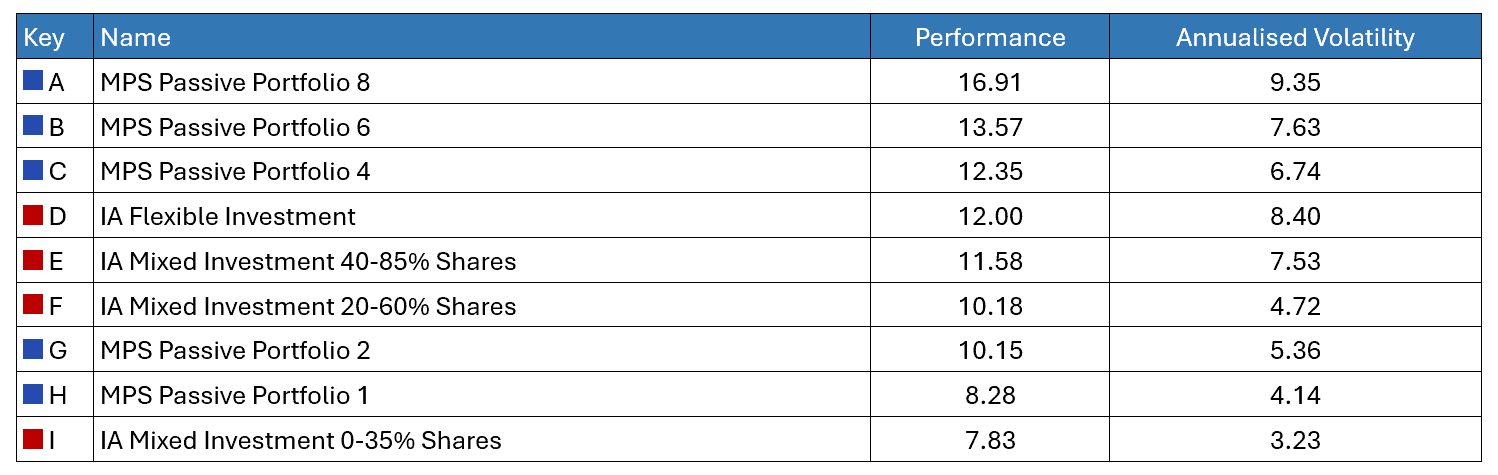
The scatter chart below shows one-year performance versus annualised volatility for IBOSS Passive Portfolios relative to IA peer group benchmarks. The data highlights competitive risk-adjusted returns across the range, particularly at higher risk levels even over this shorter period.
1 Year Scatter – Performance against Volatility – 2025
Source: FE Fundinfo
IBOSS Decumulation Portfolios
All IBOSS Decumulation outperformed their respective benchmarks in 2025 through a combination of fund selection and asset allocation as investors were rewarded handsomely for holding more diversified assets.
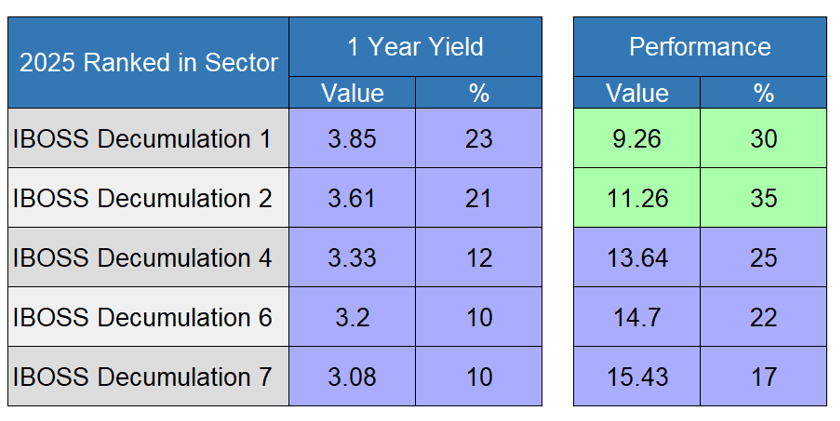
The portfolios focus on Income producing assets produced top quartile yields and first or second quartile performance over the year as outlined below.
2025 – Yield & Performance ranked against IA sector

Source: FE Fundinfo
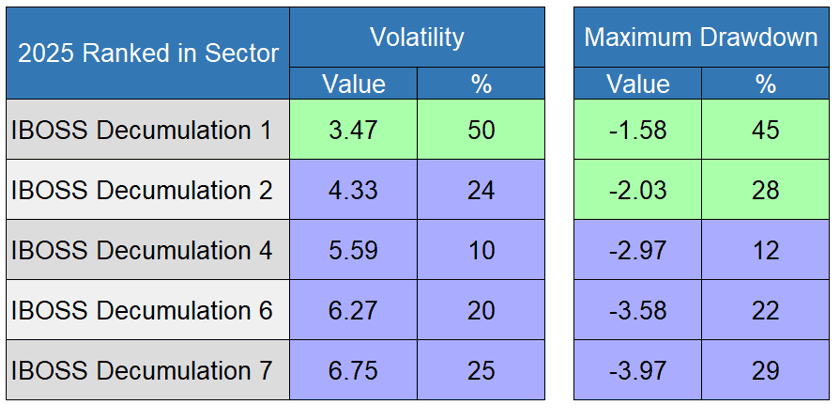
In addition to strong returns and yields, each decumulation portfolio achieved first or second quartile rankings for both volatility and drawdown during 2025. These characteristics are critical in a decumulation context, where capital preservation and consistency of outcomes are as important as return generation.
2025 – Volatility & Drawdown ranked against IA sector
Source: FE Fundinfo
The scatter chart below highlights one-year performance versus annualised volatility, comparing IBOSS Decumulation Portfolios with IA peer group benchmarks. The results demonstrate strong risk-adjusted returns across the range, particularly at lower volatility levels.
1 Year Scatter – Performance against Volatility – 2025
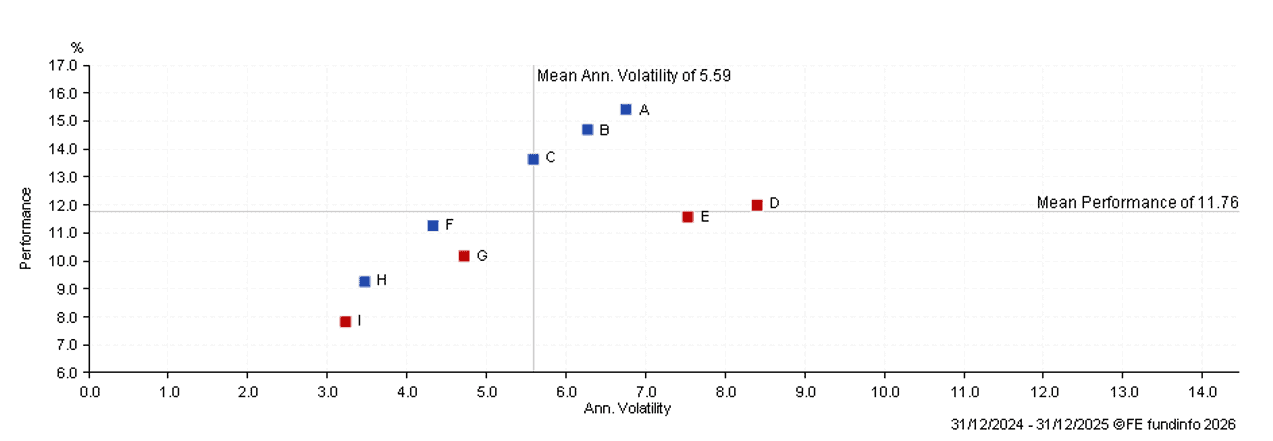
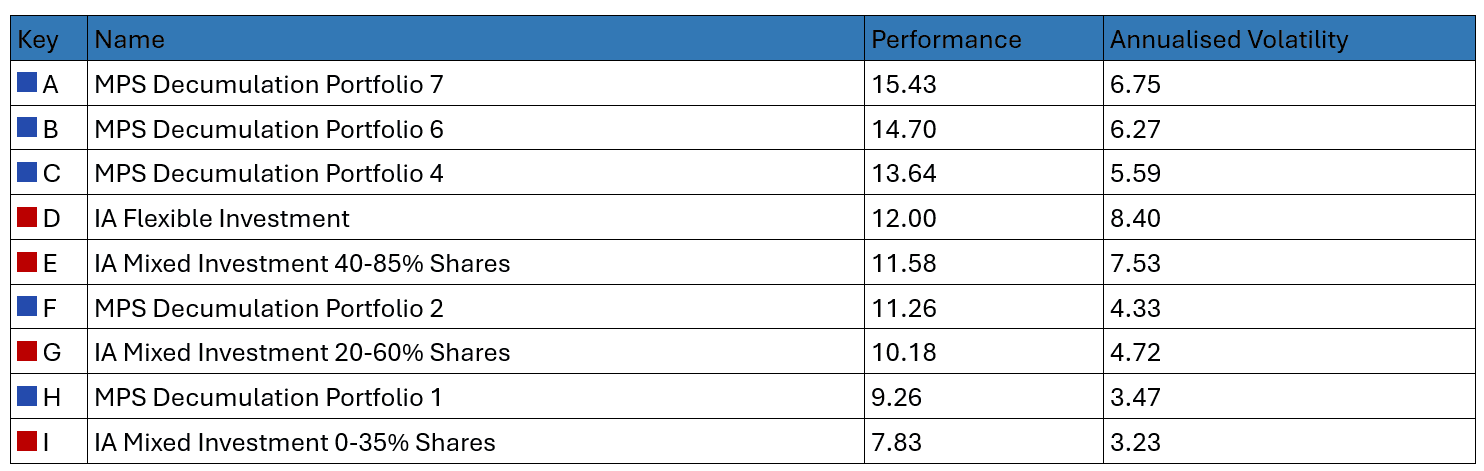
Source: FE Fundinfo
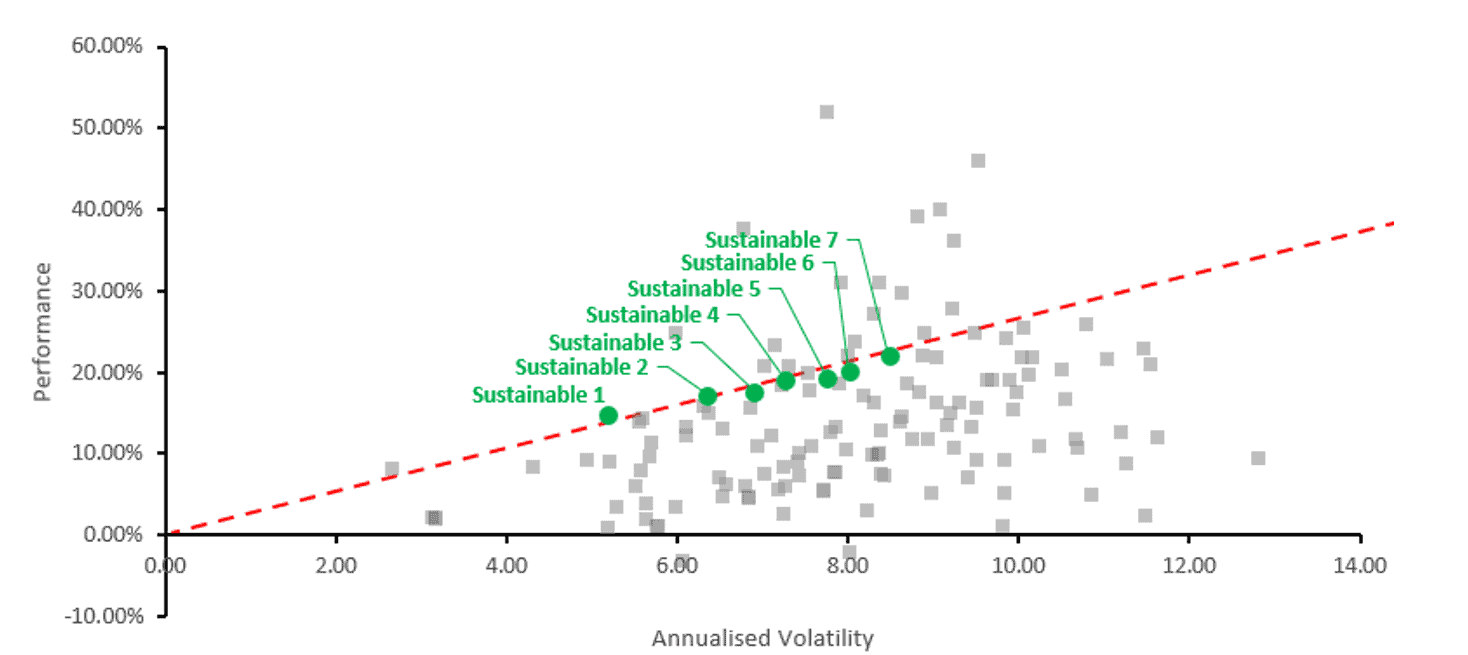
IBOSS Sustainable Portfolios
While sustainable strategies have faced headwinds in recent years relative to the broader investment universe, the IBOSS Sustainable Portfolios delivered strong relative performance in 2025.
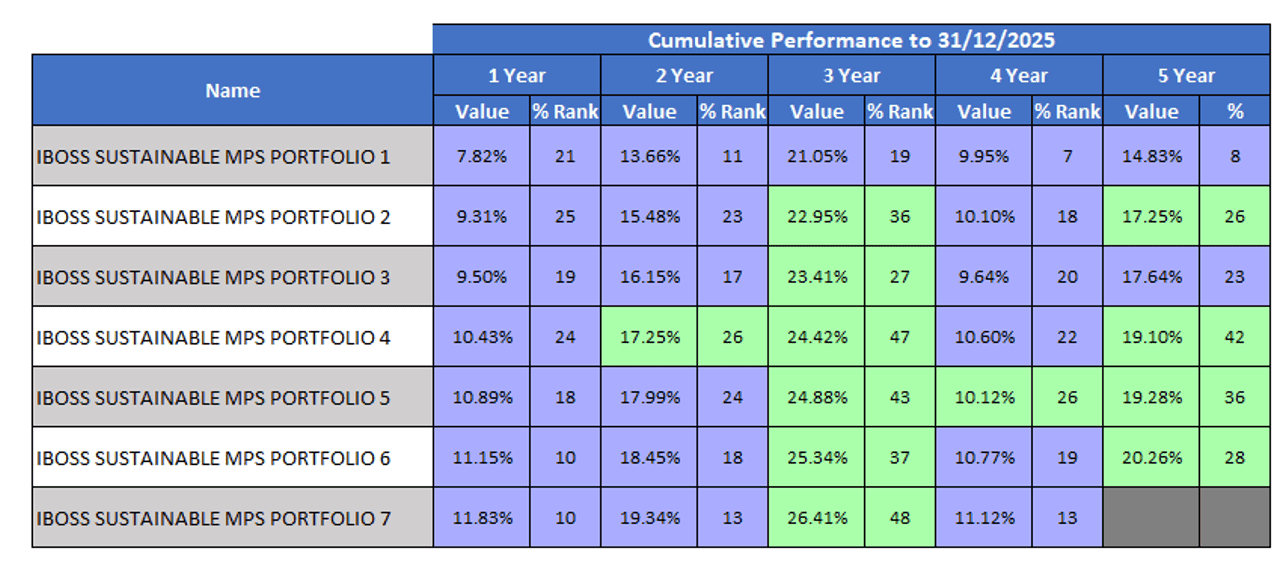
Each portfolio in the range ranked within the top 25% of actively managed sustainable peers, demonstrating effective portfolio construction and fund selection within a challenging environment. Over the year, the range generated returns of between 7.8% and 11.8% for clients across the various risk categories.
5 Year Scatter ranked against Sustainable Peers
Source: FE Fundinfo
Cumulative performance ranked against Sustainable Peers
Source: FE Fundinfo
This communication is designed for professional financial advisers only and is not approved for direct marketing with individual clients. These investments are not suitable for everyone, and you should obtain expert advice from a professional financial adviser. Investments are intended to be held over a medium to long term timescale, taking into account the minimum period of time designated by the risk rating of the particular fund or portfolio, although this does not provide any guarantee that your objectives will be met. Please note that the content is based on the author’s opinion and is not intended as investment advice. It remains the responsibility of the financial adviser to verify the accuracy of the information and assess whether the OEIC fund or discretionary fund management model portfolio is suitable and appropriate for their customer.
Past performance is not a reliable indicator of future performance. The value of investments and the income derived from them can fall as well as rise, and investors may get back less than they invested.
Some information may be short term in nature to demonstrate performance over a specific time-period and some data may contain simulated performance.
We provide the DFM MPS as both distributor and manufacturer. Details of our target market assessment can be found in our compliance investment procedures, available upon request. Each fund will be assessed independently, but it is highly unlikely that any one fund held in our portfolio will meet the target market in isolation—detail of why the inclusion collectively will be suitable is included within our research. The DFM MPS performance and displayed underlying portfolio charge is produced using the preferred share classes, this may differ from platform to platform and is shown net of fund fees only, they do not incorporate platform costs, adviser’s client fee or DFM service charge.
Data is provided by Financial Express (FE). Care has been taken to ensure that the information is correct but FE neither warrants, neither represents nor guarantees the contents of the information, nor does it accept any responsibility for errors, inaccuracies, omissions or any inconsistencies herein. Please note FE data should only be given to retail clients if the IFA firm has the relevant licence with FE.
IBOSS Asset Management Limited is authorised and regulated by the Financial Conduct Authority. Financial Services Register Number 697866.
IBOSS Asset Management Limited is owned by Mattioli Woods Limited, registered in England and Wales at Companies House, Registered number 3140521.
Registered Office is: 2 Sceptre House, Hornbeam Square North, Harrogate, HG2 8PB. Registered in England No: 6427223.
IAM 11.1.26