
If, like me, you’ve left your Christmas shopping to the very last minute, you might need some help in finding the perfect gift. Luckily, we have got you covered with some very insightful views that could help you decide when picking out those last minute ‘stock’ing fillers this year.
Genuine inflection points in markets occur relatively infrequently, but when they do, investing via the rear-view mirror could lead investors to make some poor decisions. We have been repeating this message in all of our material throughout 2022, as we believe we passed the first of these inflection points on November 30, 2021, when a speech from Fed chair Jerome Powell almost instantly changed the investing landscape. In his words, it was – “time to retire the word transitory” as he finally acknowledged the ever-higher inflation prints and the need to raise interest rates.
So, let’s put the theory to the test by looking back at the previous winners following each major inflection point that changed the broader market narrative. The infographics below list the world’s largest companies ordered by market capitalisation in Q2 of each year from 1999 to 2019.
Market Cap vs Market Value
Before diving in, it’s worth noting that market capitalisation is just one of many metrics that can help value a company.
Simply put, a company’s market cap measures the combined price of a company’s outstanding shares. In other words, it’s the price someone would pay if they wanted to purchase the company outright at current stock prices (theoretically speaking) and provides insight into what equity is worth at a given time.
Key
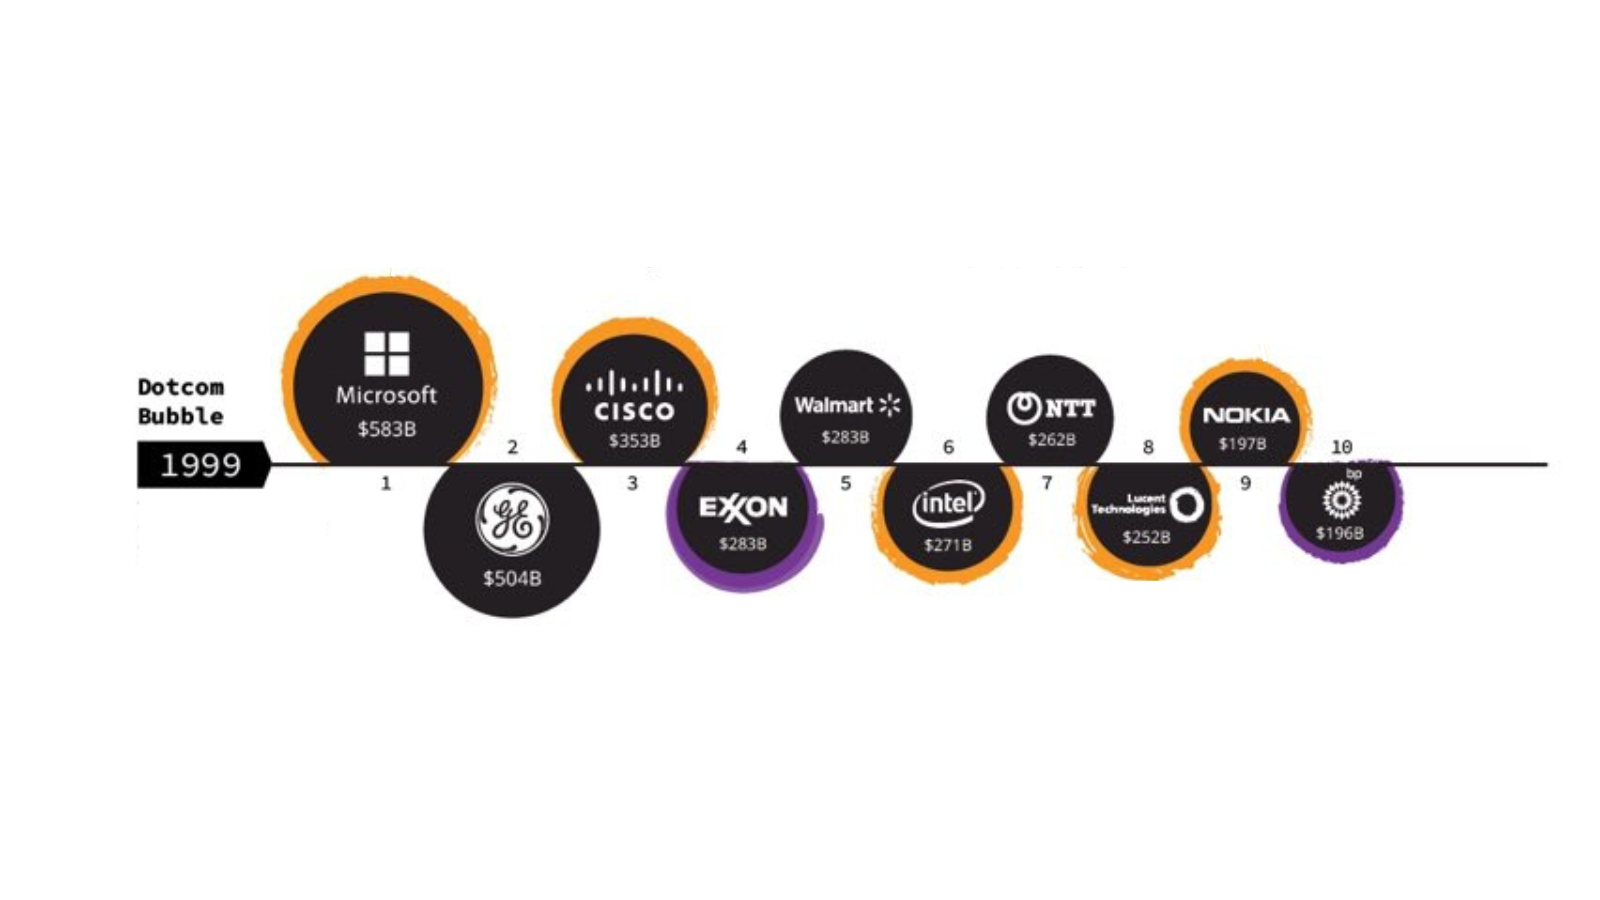
Dotcom Bubble
The dotcom bubble was a rapid rise in U.S. technology stock equity valuations fuelled by investments in internet-based companies during the bull market in the late 1990s. The value of equity markets grew exponentially during this period, with the technology-dominated Nasdaq index rising from under 1,000 to more than 5,000 between 1995 and 2000.
By the zenith of the Dotcom bubble, Microsoft broke a market capitalisation record. In December 1999, it was worth the equivalent of $931 billion in today’s terms.
The technology sector’s dominance was made up of four other spots, including Cisco, Intel, Lucent Technologies, and Nokia, who once upon a time controlled 41% of the handset market. However, the company struggled to keep up with the smartphone revolution, eventually selling its ill-fated mobile business to Microsoft.
Things started to change in 2000, and the bubble burst between 2001 and 2002, with equities entering a bear market. The following crash saw the Nasdaq index tumble from a peak of 5,048.62 on March 10, 2000, to 1,139.90 on October 4, 2002, a 76.81% fall. By the end of 2001, most dotcom stocks went bust. Even the share prices of blue-chip technology stocks like Cisco, Intel, and Oracle lost more than 80% of their value. It would take 15 years for the Nasdaq to regain its peak, which it finally did on April 24, 2015.
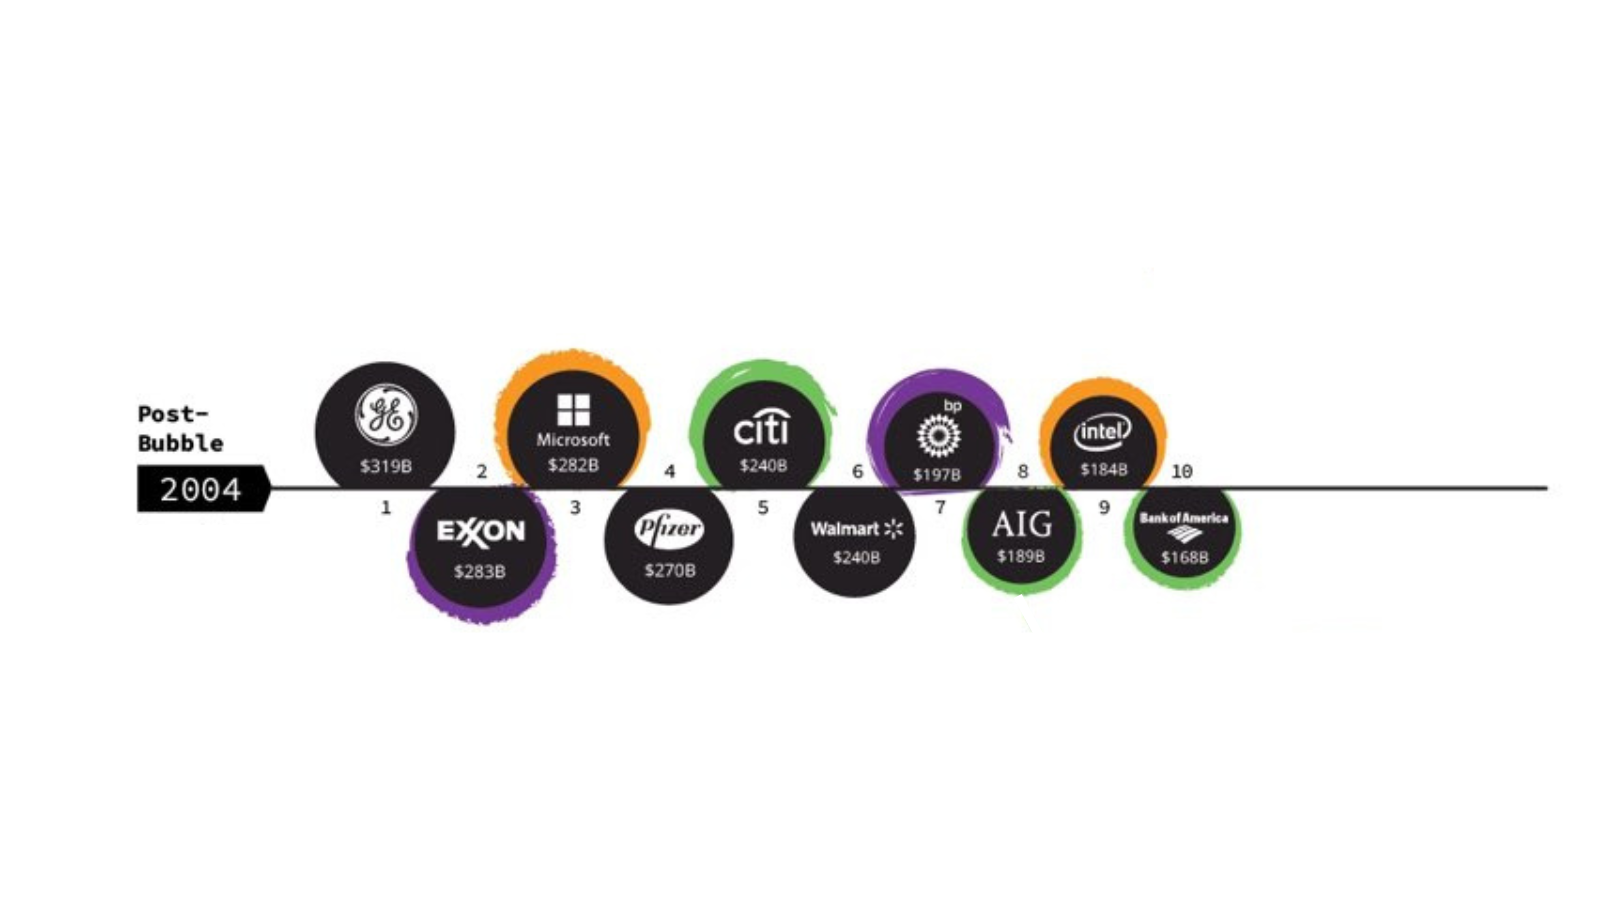
Post-Bubble
By 2004, there was no clear market cap dominance by any particular industry, but it looked different five years from the peak of the dotcom bubble. The Financial sector had the most representation with three companies, having had none in the top ten in 1999, but there was very much a mixture of companies. This included the insurance giant AIG, which was flying high before its eventual collapse during the 2008 financial crisis, requiring a $180 billion taxpayer bailout to keep it afloat.
Financial Crisis
The Global Financial Crisis (GFC) of 2008 was years in the making. Yet, despite the warning signs, few investors suspected that the worst crisis in nearly eight decades was about to engulf the global financial system, bringing Wall Street’s giants to their knees. The GFC began with cheap credit and lax lending standards that fuelled a housing bubble. When the bubble burst, the banks were left holding trillions of dollars of worthless investments in subprime mortgages. It was an epic financial and economic collapse that cost many ordinary people their jobs, life savings, homes, or all three.
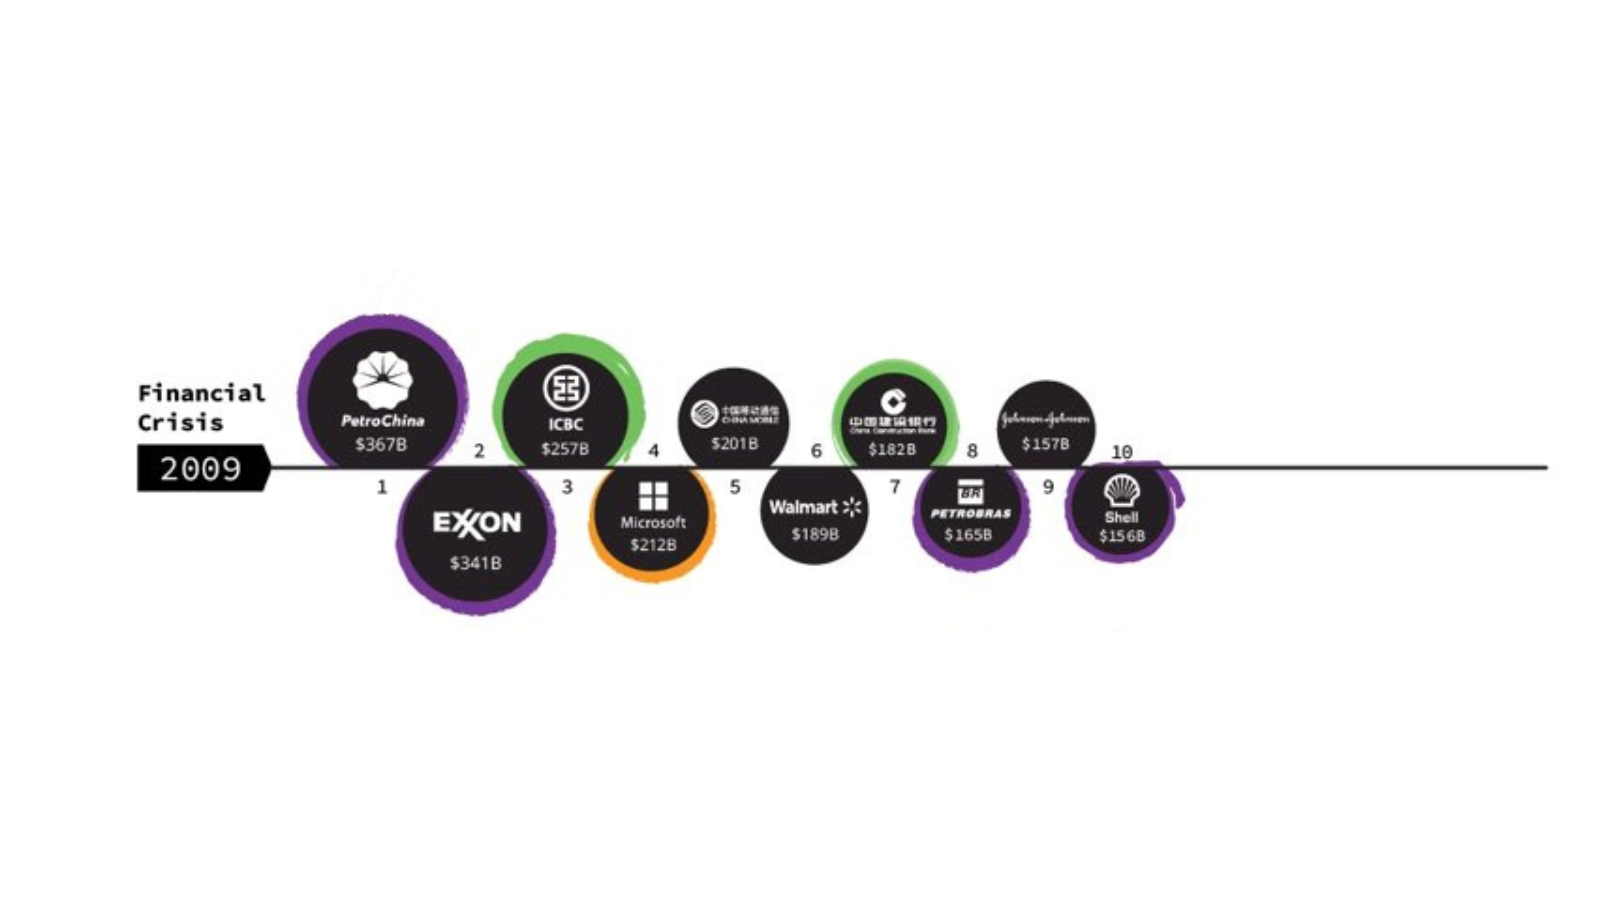 By 2009, U.S. companies had slid well down the pecking order, and several Chinese companies, riding the wave of red-hot economic growth, leapt into the top ten in the wake of the Financial Crisis. PetroChina, the country’s largest oil producer, was at the crest of the wave, and the company even briefly surpassed the $1 trillion market cap threshold in 2007, shortly after its IPO.
Energy companies had the greatest presence in the top ten, with four, and only one technology company made the list in the form of previous market cap record breakers, Microsoft.
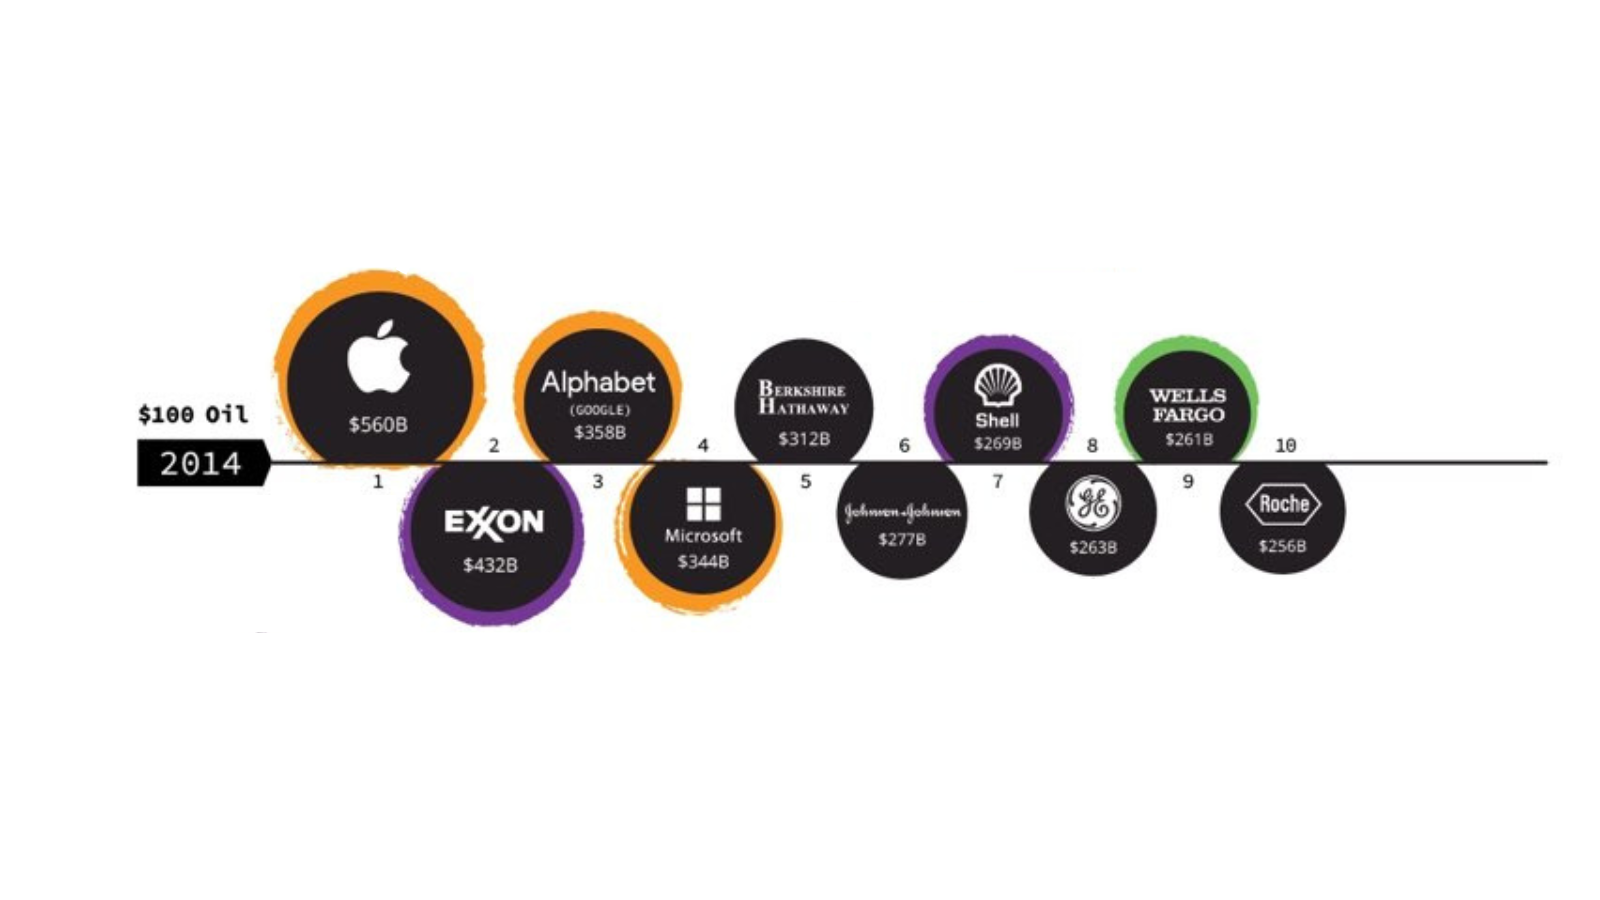
$100 Oil
In 2014, big oil was still flying high, but later in the year, oil prices collapsed. The financial sector only has one representation, whereas the tech industry is starting to come back with three of the top four spots.
This included Apple, who was at the top of the tree. The launch of the iPhone in 2007 helped complete the company’s turnaround, eventually making it the world’s most valuable company in very short order.
After leading the pack in 2004, G.E. hit a rough patch during the financial crisis and fell to eighth by 2014. After significant declines in late 2017, the company ended its 100-year run on the Dow Jones Industrial Average.
Big Tech Era
By 2019, the technology industry had completed its comeback in even greater numbers than a decade earlier, dominating the top ten with seven spots. Microsoft led the way, once again, buoyed by success in gaming and cloud computing. It had come full circle and reclaimed its position as the number one company in the world by market cap.
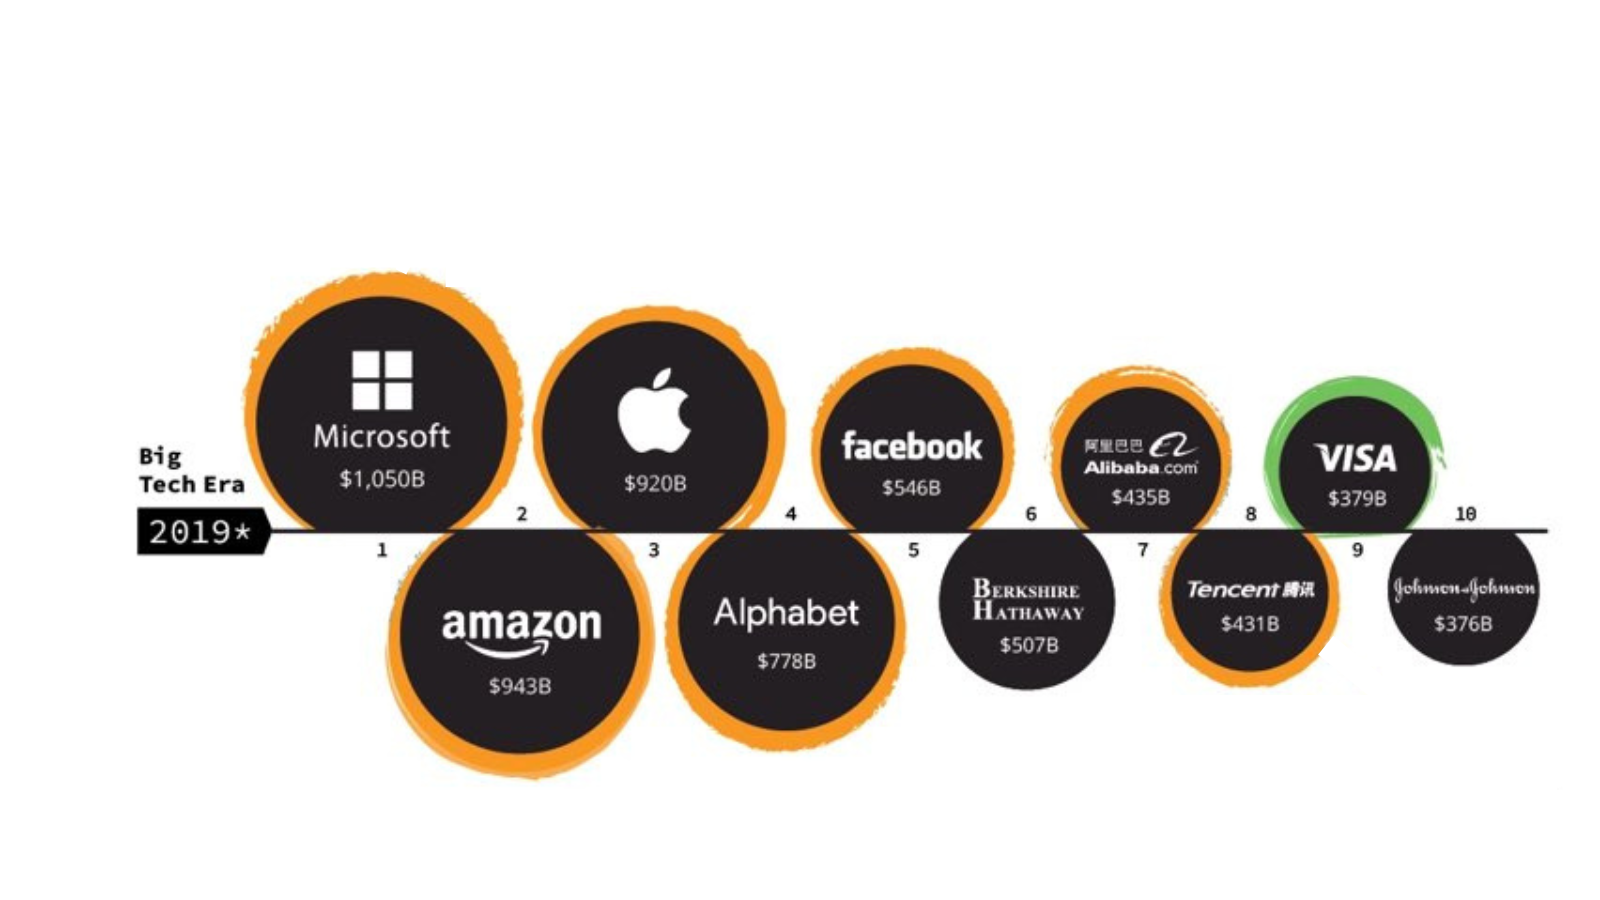
Although U.S. tech was leading the way, Chinese tech companies Alibaba and Tencent had also seen their market caps swell, respectively, sitting at seventh and eighth.
There was no room for any energy companies, but the financial sector had Visa representing its industry in ninth place.
COVID-19 Crash to Present Day
Tech companies fared well during the COVID-19 pandemic, and while some smaller tech, growth-oriented stocks started to falter following vaccine breakthroughs in Q4 2020, many larger ones continued to perform well throughout 2021.
Saudi Arabian Oil, better known as Saudi Aramco, is a Saudi Arabia-based integrated oil and gas company currently in the number two slot behind Apple. However, both have had on-and-off periods of leading the pack since January 2020.
Aggressive tightening from the Federal Reserve has caused tech stocks to plummet back to Earth in 2022, and this has shaken up the membership of the trillion dollar market cap club. Apple, Microsoft, and Aramco are all still well above the $1 trillion mark for now, but Alphabet’s trajectory could take it out of this list if circumstances don’t change soon.
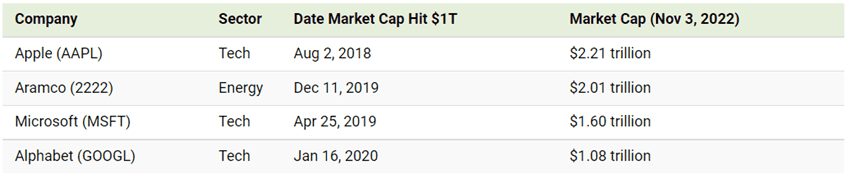
Below are the three former members of the trillion dollar market cap club who have seen their cap dip back below $1 trillion. Amazon recently became the latest company to fall below the 10-digit threshold in response to a poorly received earnings report and forecasts for lighter spending during the festive season.
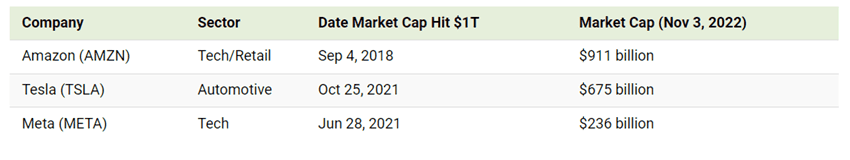
Currently, four of the five largest companies are in tech. Meanwhile, Tesla, in the sixth spot, is classified as an automotive company, but it is thought of as an “internet of cars” company by many investors. Its valuation passed that of all other automotive companies in the world some time ago. This might seem a ridiculous feat, but many investors have been badly burned trying to short tesla stock. However, even the big tech companies will likely not be immune to the impacts of a generalised economic slowdown, especially with the end of the ‘lower for longer’ era of interest rates.
The Future Members of the Top Ten
Two decades ago, the players that made up the list of the largest companies by market capitalisation were radically different—and as the years ticked by, emerging megatrends and market sentiment have worked to shuffle the deck multiple times.
We can’t begin to predict how long the next cycle will last or when the next major inflection point will occur. However, our view is that we don’t expect the investing landscape of the next ten years to look like it has for the previous ten, and we expect new winners to emerge.
We think the next relative winners may well be the opposite of the countries who most benefitted from globalisation. That could mean different global emerging markets, potentially India, but it’s hard to say which; that’s why we outsource these decisions to our expert fund managers.
After years of malinvestment in the whole energy complex, and commodities more broadly, the world is facing a new and urgent reality. We must collectively deal with the largely indeterminate period between our current energy requirements and resources, and the transition to genuinely sustainable energy and reliable food supply chains. Winners here should be commodity exporters such as Brazil, but at the same time, we will also see food nationalism in certain areas, increasing prices and putting more pressure on supply chains.
Giant U.S. tech took on almost deity-like levels of worship. Still, valuations matter, and many of these companies just got too expensive, as well as often being led by megalomaniacs who start believing in their omnipotence. A decent chunk of the valuations was predicated on lower forever interest rates and a belief that, in any event, a timely exit could be carried out before enough people realised what was really going on.
We appear to have already entered a new era based more on price discovery and fundamentals than the smoke and mirrors period of the post-GFC age.
Summary
As asset managers, we give the responsibility of individual stock picking to the fund managers, whom we deem to make the right decisions ‘most’ of the time. As ever, we manage the IBOSS portfolios with a significant emphasis on diversification. Therefore, we wouldn’t overload our portfolios with any particular sector, industry or geography, thus allowing us to make smaller overweights and underweights as we sit fit at each quarterly rebalance and, where possible, avoiding concentration risk.
From the client feedback our advisers are receiving, they seem concerned that markets have gone through an inflection point. At times like this, we believe it is important to be aware that times have changed, and communication with clients about what is happening will be more critical than ever.
It seems that in this new investment world, which is post ‘transitory’, the coming months and years will provide a significant opportunity for advisers to demonstrate the value of their advice. Nothing is ever certain in investing, but it feels like the era of rear-view mirror investing predicated on central back pivots is perhaps over and that a more considered approach which takes old-fashioned values, like profit and a good business model, will come back to the fore and a genuine diversification of assets will be rewarded.
Sources:
Visual Capitalist Trillion Dollar Club
https://www.investopedia.com/articles/economics/09/financial-crisis-review.asp
https://www.investopedia.com/terms/d/dotcom-bubble.asp
This communication is designed for informational purposes only and is not intended as investment advice. These investments are not suitable for everyone, and you should obtain expert advice from a professional financial adviser. Please note that the content is based on the author’s opinion at the time of writing/publish date. Our views and opinions regarding certain investment themes and topics can alter over time as the macroeconomic background changes and other industry news is made publicly available, this is not intended as investment advice.
Past performance is not a reliable indicator of future performance. The value of investments and the income derived from them can fall as well as rise, and investors may get back less than they invested.
IBOSS Asset Management is authorised and regulated by the Financial Conduct Authority. Financial Services Register Number 697866.
Registered Office: 2 Sceptre House, Hornbeam Square North, Harrogate, HG2 8PB. Registered in England No: 6427223.
IAM 347.12.22