

Of the investment biases that are most challenging to overcome, ‘recency biases’ are arguably the hardest. The longer a trend continues, the harder that task becomes. Not only is fighting your own doubts tough to overcome, but there is a reasonable chance that you will also invite criticism from clients by moving away from previous winners.
Over the past few years, North America has taken most of the headlines in both the equity and fixed income space. There are many reasons for this; the US is the largest economy globally and it has multiple finance-oriented TV shows which are US-centric, no doubt influencing many investor mindsets. It has also just experienced four years of unrelenting tweeting from the White House, by a President who judged his popularity, if not his overall success, by the value of the Dow Jones.
Whilst the US has done remarkably well, China has eclipsed it over the last five years, outperforming by circa 75% (fig.1). If Mr. Trump does indeed believe that stock market valuations measure success, he must then surely acknowledge that China was the winner?
IA China/Greater China Vs. IA North America performance during the Trump Presidency (fig.1)
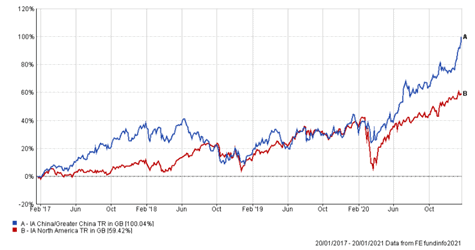
Information displayed is short term in nature to demonstrate performance over a specific time period. Please contact IBOSS for long term data, including since launch and/or 5 years.
International equities versus US
Of course, there is more than China against which the US markets are competing. The chart (fig.2) shows the main international equity sectors from a UK investor perspective over the past year. This data set includes the Covid market crash and the subsequent rally, and these two distinct periods have respectively broken multiple records.
The clear winner once again was China, but broader Asian markets and emerging markets have also performed exceptionally well. In fact, the only geographical region the US has beaten over the last 12 months is Europe.
International IA sectors Vs. IA North America one year performance (fig.2)
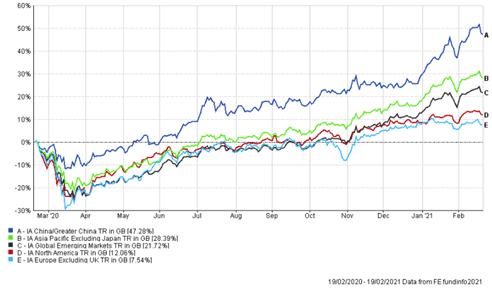
Information displayed is short term in nature to demonstrate performance over a specific time period. Please contact IBOSS for long term data, including since launch and/or 5 years.
Sometimes, it is actually different
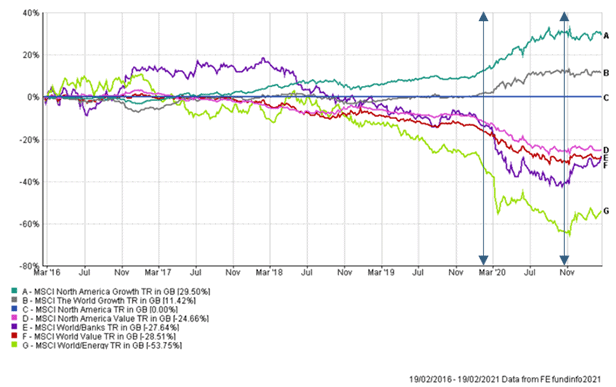
If we ignore stock specifics for most of the past five years, the best investment style was growth. America has some of the best known and most successful growth stocks on the planet, and this was before the pandemic catapulted their valuations (fig.3) into the stratosphere.
As the initial outlook deteriorated, the ‘working from home’ type stocks just increased in relative value. As for energy, well you could barely give oil away, and if you did it would actually have cost you to do so, as the futures contract went briefly negative in April 2020.
MSCI (selected) sectors Vs. Growth Vs. Value relative to North America five year performance (fig.3)
The investing world changed at the end of October 2020 (fig.4), and the changes are beginning to look more and more like a new investing era. This new chapter is not about the US versus other geographies or even a simple investing style change from growth to value. Global energy and financial stocks, especially the banks, are on an absolute tear and this is all about the post-pandemic global economy.
MSCI (Selected) Sectors Vs. Growth Vs. Value relative to North America 28th Oct 2020 to 19th Feb 2021 Performance (fig.4)
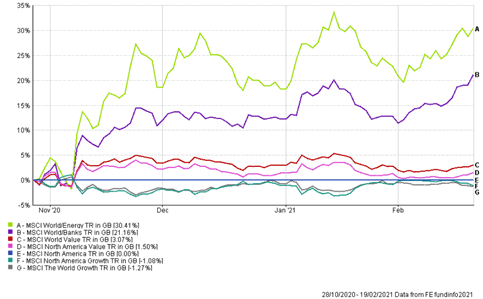
Information displayed is short term in nature to demonstrate performance over a specific time period. Please contact IBOSS for long term data, including since launch and/or 5 years.
At the same time, we suddenly find very little pushback to our expectation of rapidly rising inflation. Many commodity prices are hitting new highs by the day, and concurrently the US sovereign bond market is repricing to the downside at its fastest rate since the taper tantrum back in 2013.
It is not just the US sovereign bonds that are selling off either, the UK too has seen its gilt yields move aggressively higher. The violent upward movements in the energy and commodity sectors across the globe, higher bond yields and even the super speculative idiosyncratic stock moves, such as the likes of Gamestop, are all to some degree interlinked.
The debt dream team (Biden/Yellen), now in charge of US fiscal policy, came to power very close to the positive vaccine news and the first glimpse of what a post-pandemic world might look like in terms of the economy.
The outcome seems clear; unprecedented spending power is about to be unleashed in various countries worldwide whose economies have been the hardest hit. The ECB, Fed and much of the world are in favour of keeping monetary policy lose, practically indefinitely. Some have even stated they won’t change policy, i.e., raise interest rates even if inflation starts to overshoot their model expectations.
So, where is the stress likely to be felt most acutely in an environment where all authorities are hell-bent on throwing money into their economies and central banks are promising to sit on their hands?
The answer is potentially the bond market, commodity prices and any asset which performs well in an inflationary environment.
To conclude, this is a radically different macro backdrop to anything we have ever seen before and this time really is different, and the most pertinent question right now is; to what level of magnitude?
This communication is designed for Professional Financial Advisers only and is not approved for direct marketing with individual clients.
Past Performance is no guarantee of future performance. The value of an investment and the income from it can fall as well as rise and investors may get back less than they invested. Risk factors should be taken into account and understood including (but not limited to) currency movements, market risk, liquidity risk, concentration risk, lack of certainty risk, inflation risk, performance risk, local market risk and credit risk.
Data is provided by Financial Express (FE). Care has been taken to ensure that the information is correct but FE neither warrants, neither represents nor guarantees the contents of the information, nor does it accept any responsibility for errors, inaccuracies, omissions or any inconsistencies herein. Please note FE data should only be given to retail clients if the IFA firm has the relevant licence with FE.
IAM 86.2.21