

NVIDIA: 8.5% -> 6.3% -> 5.7% of the S&P 500
Though not strictly an October event, NVIDIA has seen huge moves following revelations about the CEO’s extramarital relationships and, more recently, his removal as head of the company. The stock has fallen 33% from its high, losing its position as the world’s largest company. If that wasn’t bad enough, various interested and often conflicted parties have since called for his reinstatement. More intrigue may yet emerge but, for now, the chaotic unravelling of the stock sometimes referred to as the central bank of AI is dragging down the whole sector and even some country indices.
As the former largest constituent of both the US and global equity markets, this matters to virtually every investor. The reality is that if you’re invested, there’s a good chance you own at least some NVIDIA.
Concerns around the AI trade, its reach across global markets and the potential for circular funding within the wider AI ecosystem are well documented. Interestingly, many of the loudest voices spent years arguing that the AI boom would eventually be derailed by AI itself, often through increasingly apocalyptic scenarios. While investors focused on grand macro narratives, few suggested that a pullback could arise from the far more prosaic issue of key-man risk.
We expect more stories to emerge from the NVIDIA woodwork, but it is already clear that investors paid relatively little attention to the possibility of life after Jensen Huang. Having been NVIDIA’s only CEO since launch, he became almost inseparable from the company in many investors’ minds. Recent events are a reminder that no matter how strong a business may be, key-person risk remains very real and succession planning matters.
Whatever happens next, the story is a useful reminder that markets can change quickly and without warning. It also highlights how damaging drawdowns can be to long-term returns. While NVIDIA has fallen 33%, it now needs to rise 49.4% just to regain its previous high.
As ever, we have no idea where the story ends for NVIDIA or any of the other large technology companies. Anthropic’s IPO may yet throw another spanner into the AI machine. Either way, we believe it reinforces the importance of remaining diversified across sectors, regions and investment themes rather than relying too heavily on a small number of market leaders.
The Midterms, The Blue Wave, and the Unexpected Winners
Heading into the US midterm elections, many commentators suggested that a strong Democratic result could prove challenging for parts of the AI trade. Concerns centred on stricter regulation, environmental scrutiny and additional hurdles for the data centres that have become essential to the AI boom. While these concerns remain largely theoretical, markets wasted little time repositioning following what became known as the “Blue Wave”, or rather more dramatically, the “Blue Tsunami”.
What has been particularly interesting is not so much the political result itself, but the market reaction beneath the surface. For much of the past two years, investors were rewarded for owning the beneficiaries of the AI build-out. The US, Taiwan and Korea became key destinations for capital as investors sought exposure to the companies building the chips, servers and infrastructure needed to support the AI revolution.
However, in the week following the election, we saw something of a reversal. Markets largely left behind during the AI-led rally suddenly topped the performance tables. India returned 8.2%, Mexico 4.4%, Emerging Europe 3.5% and the UK 2.3%, while Taiwan, Korea and the broader technology sector lagged noticeably behind (data as at 12/11/2026).
For now, the table has effectively flipped. The so-called AI winners have become the laggards, while many perceived AI losers have moved to the front of the queue.
Whether this proves to be a lasting trend or merely a short-term rotation remains to be seen. What it does demonstrate is how quickly market narratives can change. Investors spent much of the last two years focused on a remarkably small group of countries, sectors and companies. When the headlines changed, even briefly, so too did market leadership.
Perhaps most importantly, the episode reminds us that investing often becomes most dangerous when the future appears most obvious. At the start of the month, relatively few investors expected India to outperform the US, or Mexico to outperform technology. Yet that is exactly what happened. Markets have a habit of rewarding the unexpected, which is why broad diversification often feels least necessary immediately before it becomes most valuable.
IBOSS AM Performance Update
October was an excellent month for the IBOSS MPS range. The Passive range performed particularly well, while the increasingly popular Decumulation range was among the standout performers. Returns across the board would have been higher still had the opening stages of the recent US market correction not fallen into November’s reporting period.
What worked and what didn’t
The largest contributors to performance were our overweights to Infrastructure, UK equities and Commodities, while the largest detractors were Emerging Markets, Asia and, in a sharp reversal from last month, Japan. In absolute terms, the lower-risk and Decumulation portfolios were the only areas to generate positive returns, benefiting from higher bond allocations and a bias towards dividend-paying stocks.
So, what’s changed?
We expect these trends to persist and have increased bond duration across the IBOSS range, excluding Portfolio 8, our dedicated equity portfolio. At the same time, we have reintroduced a second absolute return fund to broaden our sources of alpha while further strengthening the defensive characteristics of the Core range.
Diversification continues to pay-off over the long term
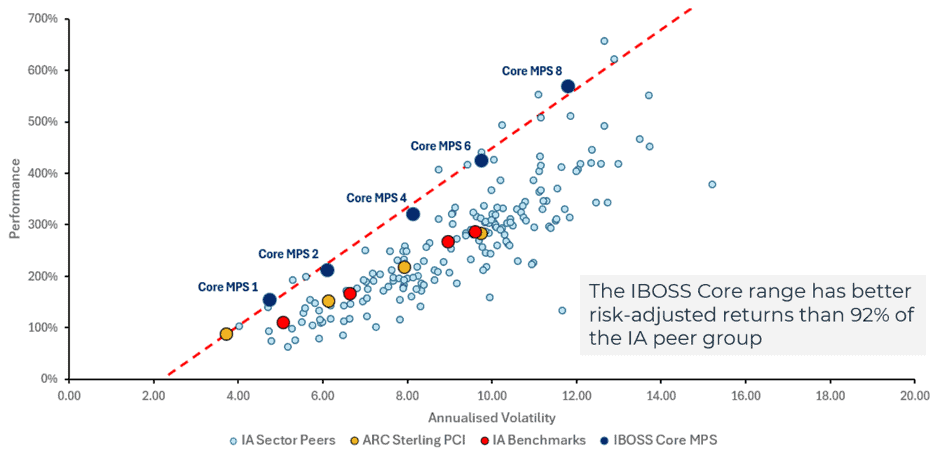
Since 2008, we have managed the IBOSS portfolios on the principle that every sector is a portfolio in its own right. Each IBOSS sector must therefore deliver on the same objective as the overall portfolio: outperform its relevant benchmark (IA Sector) while experiencing lower drawdowns and less volatility.
IBOSS Emerging Market Performance 01/11/2008 > 31/10/2026 (fig.1)
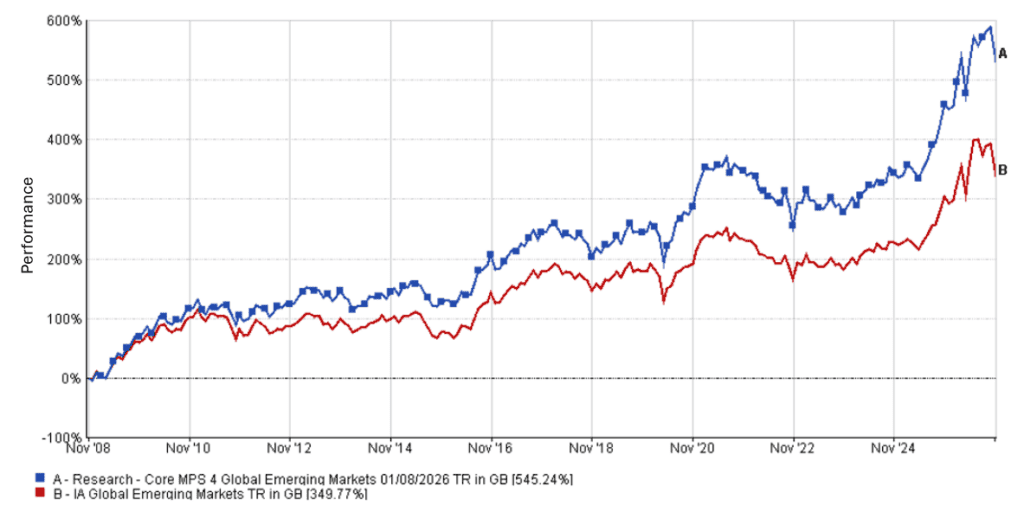
IBOSS Emerging Market Performance Characteristics 01/11/2008 > 31/10/2026 (fig.2)

As Figure 2 shows, our Emerging Markets sector has achieved its objective over the long term. Even over three years, its Sharpe ratio ranks in the top decile for risk-adjusted returns. To some, using around forty funds may appear to dilute returns. In reality, the opposite has been true, helping us outperform more than 90% of peers since launch in 2008. Diversification remains the most effective way to reduce drawdowns and sequencing risk while staying fully invested, and every IBOSS portfolio is built on that principle.
Be Prepared
For much of the period since the Global Financial Crisis, portfolio returns have been driven by US equities and, increasingly, a handful of companies such as the Magnificent Seven. That changed with Donald Trump’s return to office, ushering in a market environment unlike anything investors have experienced since January 2025.
Since then, investors have been rewarded for broader geographic diversification, enjoying not only stronger returns but also a smoother ride. Highly concentrated, high-conviction strategies can deliver spectacular gains, but they also leave investors exposed when consensus views prove wrong. One only needs to look at recent forecasts for oil prices and the expected impact of the Iran conflict to see how quickly expert predictions can unravel.
Markets like this demand humility, discipline and an acceptance that much of what drives returns cannot be forecast with precision. Rather than attempting to predict every twist and turn, we focus on building resilient portfolios capable of navigating a wide range of outcomes. Every IBOSS portfolio is positioned with exactly this philosophy in mind.
IBOSS CORE: Start of Data Risk & Return (01/11/2008 – 31/10/2026)
IBOSS CORE: 3 Year Risk & Return (01/11/2023 – 31/10/2026)
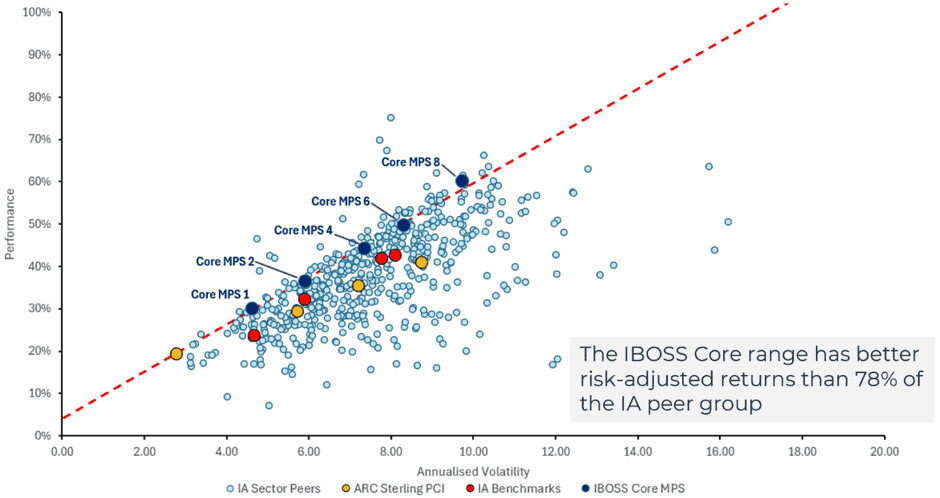
The data presented covers a limited time period due to the context of this metric. Short-term performance may not be indicative of long-term trends. Investors should consider longer-term performance data and other relevant factors before making investment decisions.
This communication is designed for professional financial advisers only and is not approved for direct marketing with individual clients. These investments are not suitable for everyone, and you should obtain expert advice from a professional financial adviser. Investments are intended to be held over a medium to long term timescale, taking into account the minimum period of time designated by the risk rating of the particular fund or portfolio, although this does not provide any guarantee that your objectives will be met. Please note that the content is based on the author’s opinion and is not intended as investment advice. It remains the responsibility of the financial adviser to verify the accuracy of the information and assess whether the OEIC fund or discretionary fund management model portfolio is suitable and appropriate for their customer.
Past performance is not a reliable indicator of future performance. The value of investments and the income derived from them can fall as well as rise, and investors may get back less than they invested.
IBOSS Asset Management Limited is authorised and regulated by the Financial Conduct Authority. Financial Services Register Number 697866.
IBOSS Asset Management Limited is owned by Mattioli Woods Limited is registered in England and Wales at Companies House, Registered number 3140521.