

Market conditions don’t stay static, and nobody rings a bell at a market top.
The longer a particular set of market conditions persists, the easier it becomes to believe that making money is simply a matter of buying more of what has already performed well. It is a perfectly natural instinct. We are drawn to assets that have risen in value because we assume they are the ones most likely to continue delivering strong returns. Buying what has worked can indeed be a successful strategy. The challenge, however, is knowing for how long that success will last, years, months or merely a matter of hours.
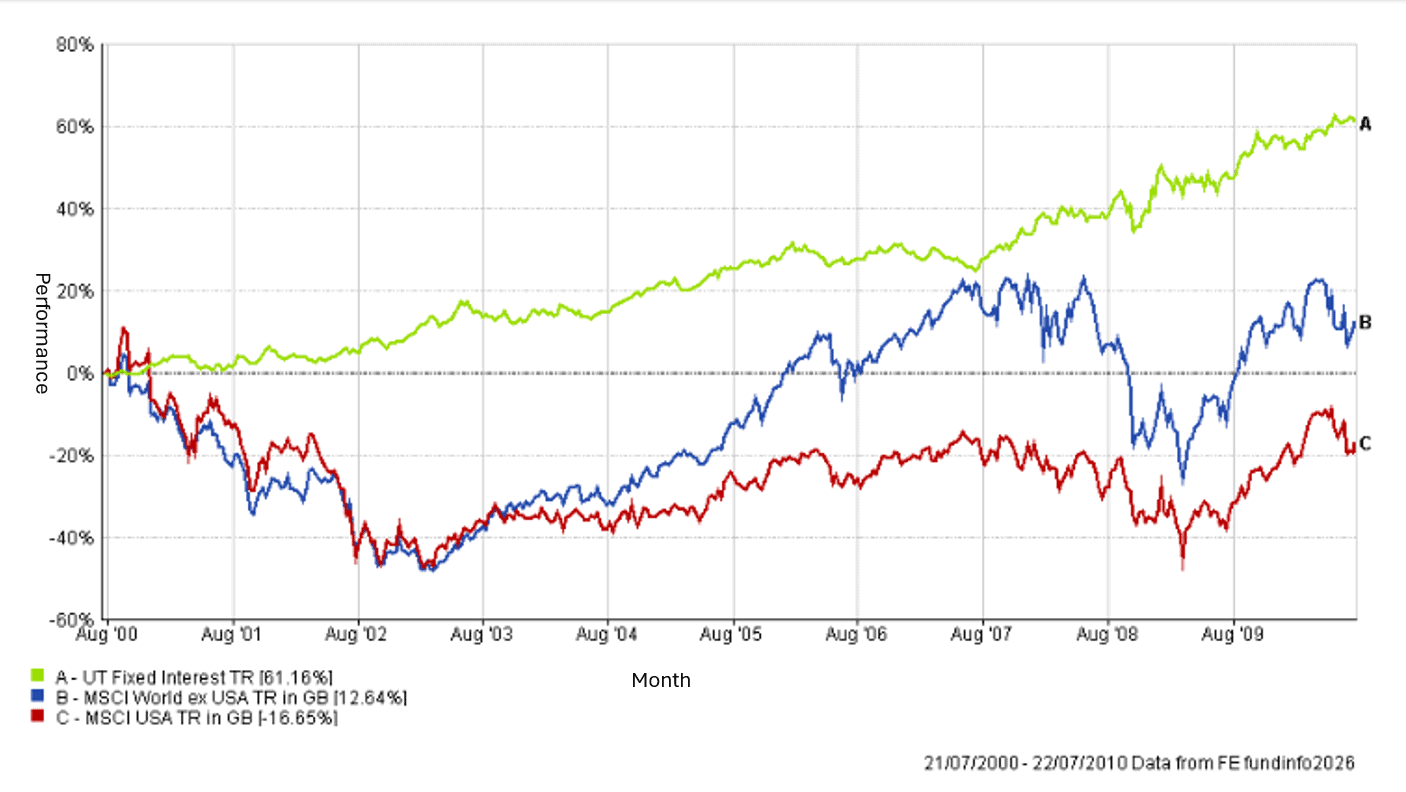
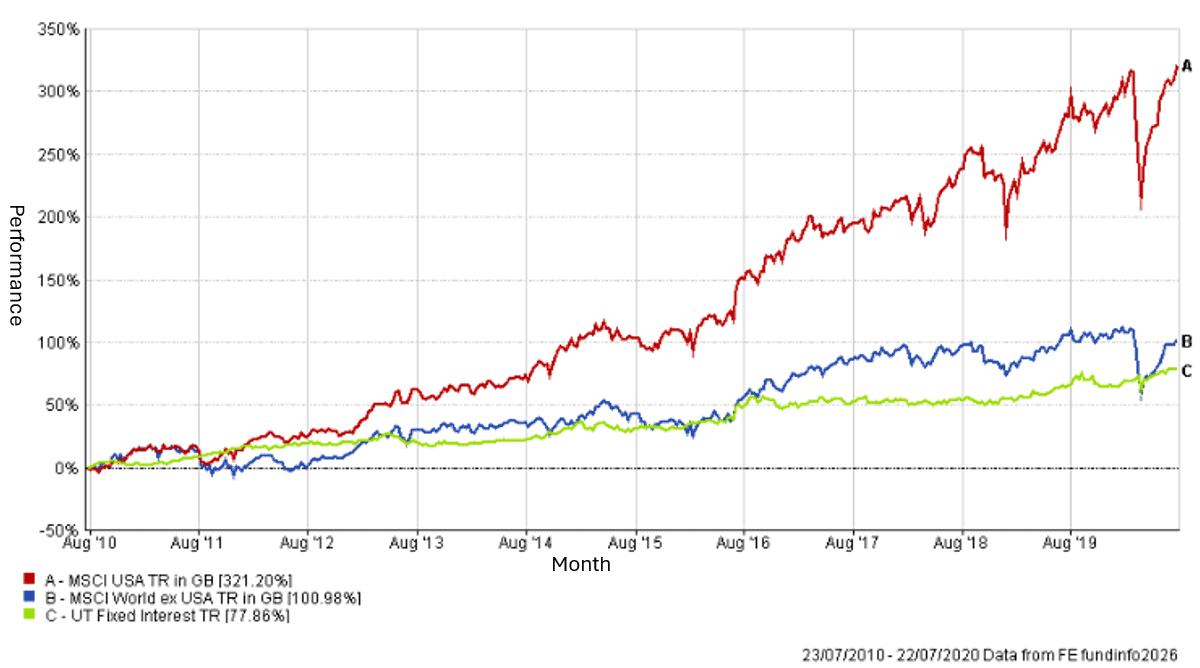
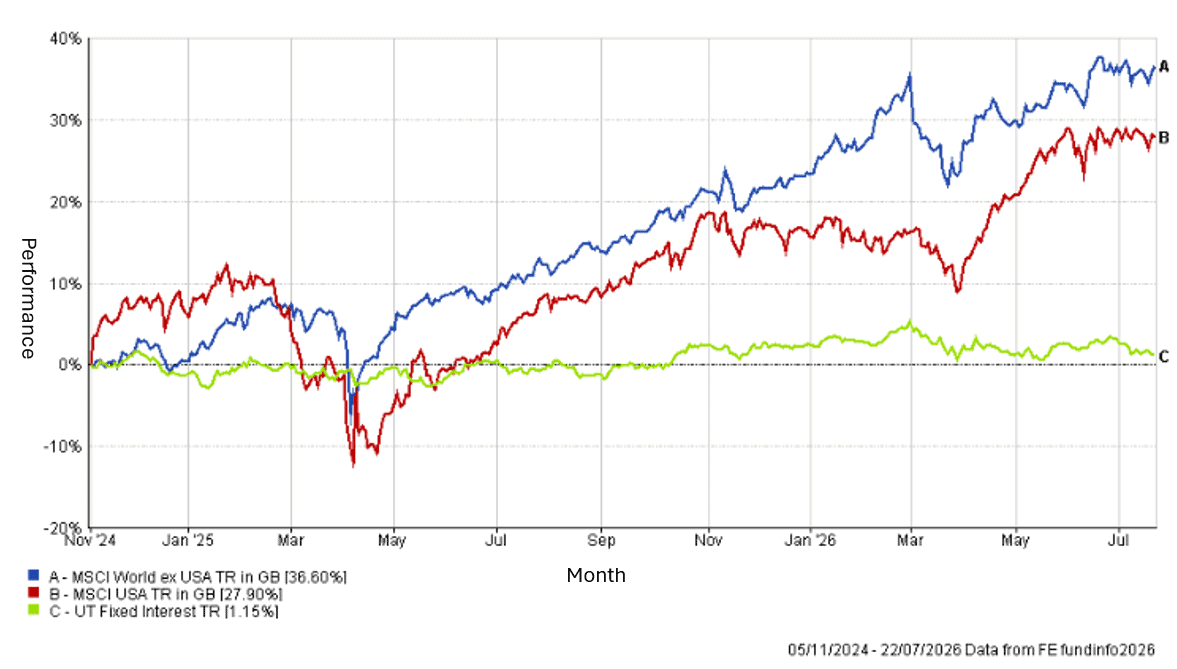
The charts below compare the performance of just three asset classes, US equities (MSCI USA), global equities excluding the USA (MSCI World ex USA) and Fixed Income (UT Fixed Interest). Each chart covers a 10-year period, long enough to smooth out much of the short-term market noise and broadly representative of a typical investment horizon.
The reasons behind the dramatically different outcomes over these two decades are fascinating, but they are not the central message. What matters most is that market leadership can change beyond all recognition, and consistently identifying market tops and bottoms is virtually impossible.
Had you been constructing a relatively concentrated portfolio in July 2010 using only these three asset classes, something we would not recommend, you would almost certainly have allocated heavily to fixed interest, with a much smaller weighting to equities and only a modest exposure to the US. Looking at the preceding decade, that would have appeared entirely rational. With the benefit of hindsight, however, we know it would have produced a significantly inferior outcome, as illustrated in Figure 2.
The lesson is a simple but important one. Yesterday’s winners rarely remain tomorrow’s winners forever. Markets evolve, leadership rotates, and investment success depends less on chasing what has already happened than on maintaining a diversified portfolio that is prepared for what comes next.
Performance Line Chart – 21/07/2000 – 22/07/2010 (Fig.1)
Source: FEfundinfo
Performance Line Chart – 23/07/2010 – 22/07/2020 (Fig.2)
Source: FEfundinfo
Looking Forward
As of 23 July 2026, global equities are relatively expensive and, within that, US equities remain the most expensive market overall. Those observations alone should give investors pause for thought. By contrast, Fixed Income, the green line (C), is cheaper than it has been for many years.
It is also important to recognise that not everything is expensive. We believe property and listed infrastructure offer attractive long-term opportunities following several years of underinvestment and subdued valuations. The same is true of commodities, where a lack of investment has constrained future supply. In other words, while some areas of the market appear fully valued, others continue to offer compelling opportunities.
More than ever, we believe a genuinely diversified portfolio is the best way to capture those opportunities while also helping to protect against potentially significant drawdowns. Concentrated portfolios with large exposures to a single geography, sector or asset class inevitably increase concentration risk, the danger that many holdings decline simultaneously with little or no offset from other parts of the portfolio.
As we have often said, nobody rings a bell at the top of a market. However, the global backdrop that has supported some of the world’s best-performing investments over the past few years has deteriorated noticeably. That does not necessarily mean those assets will perform poorly from here, but it does suggest investors should place greater emphasis on diversification and valuation than on simply extrapolating recent performance into the future.
Trump 2.0
The final chart shows the period since Trump returned to office, and this has ushered in a much more challenging period for US assets versus the rest of world. This is just the latest example of how past winners will not necessarily be the winners of tomorrow and highlights the importance of maintaining a diversified approach, which acknowledges that recognising the future for investment markets of any kind is inherently uncertain.
Performance Line Chart – 05/11/2024 – 22/07/2026 (Fig.3)
Source: FEfundinfo
The data presented covers a limited time period due to the context of this metric. Short-term performance may not be indicative of long-term trends. Investors should consider longer-term performance data and other relevant factors before making investment decisions.
This communication is designed for professional financial advisers only and is not approved for direct marketing with individual clients. These investments are not suitable for everyone, and you should obtain expert advice from a professional financial adviser. Investments are intended to be held over a medium to long term timescale, taking into account the minimum period of time designated by the risk rating of the particular fund or portfolio, although this does not provide any guarantee that your objectives will be met. Please note that the content is based on the author’s opinion and is not intended as investment advice. It remains the responsibility of the financial adviser to verify the accuracy of the information and assess whether the OEIC fund or discretionary fund management model portfolio is suitable and appropriate for their customer.
Past performance is not a reliable indicator of future performance. The value of investments and the income derived from them can fall as well as rise, and investors may get back less than they invested.
IBOSS Asset Management Limited is authorised and regulated by the Financial Conduct Authority. Financial Services Register Number 697866.
IBOSS Asset Management Limited is owned by Mattioli Woods Limited is registered in England and Wales at Companies House, Registered number 3140521.
Registered Office is: 2 Sceptre House, Hornbeam Square North, Harrogate, HG2 8PB. Registered in England No: 6427223.
Approved July 2026
IAM 237.8.26