

This debate will probably outlive us all. If anyone doubts the strength of feeling on both sides, try posting a chart on LinkedIn showing the benefits of one approach over the other and wait for the counterarguments to flood in.
At IBOSS, we run three approaches: a Core range that is roughly 75% active and 25% passive, a 100% passive range, and a blended range that combines the two.
The reality is that a cohort of active managers does beat their benchmarks or sectors on a relatively consistent basis. The challenge is that the number of outperformers ebbs and flows, influenced by many factors, but two are always critical:
- the prevailing market conditions
- the manager’s willingness to deviate meaningfully from the benchmark
It has never been the case that no active managers can outperform. Even in the notoriously difficult US market, we have seen managers do so over the past year. That is largely because Trump has upended global trade relationships and brought an end to the idea that the US is the answer to almost everything. The key question is whether these conditions persist. We believe they will. As a result, we are relatively bullish on actively managed US value strategies and small and mid-cap stocks, and relatively bearish on US growth. Lots of very good companies but very high valuations and some new headwinds.
Outside the US, the UK provides a good example of why fighting the last war can be so damaging to returns. It is widely accepted that the UK has been a difficult market for much of the last decade. Whether the causes are Brexit, central bank missteps, the Trump effect, or poor government, it was not until early 2021 that the FTSE 100 began to outperform global peers, and even now the FTSE 250 is only just holding its own.
We currently hold six UK funds (shown in Fig. 2): five active funds and one passive, the HSBC FTSE 100 tracker. Over the last three years, we have narrowly outperformed the tracker, despite our active managers having greater exposure to smaller and mid-cap stocks. Notably, the FTSE 100 tracker itself has significantly outperformed the IA UK All Companies sector. As is often highlighted, the largest UK stocks are highly international in nature and are a very different proposition from the FTSE 250.
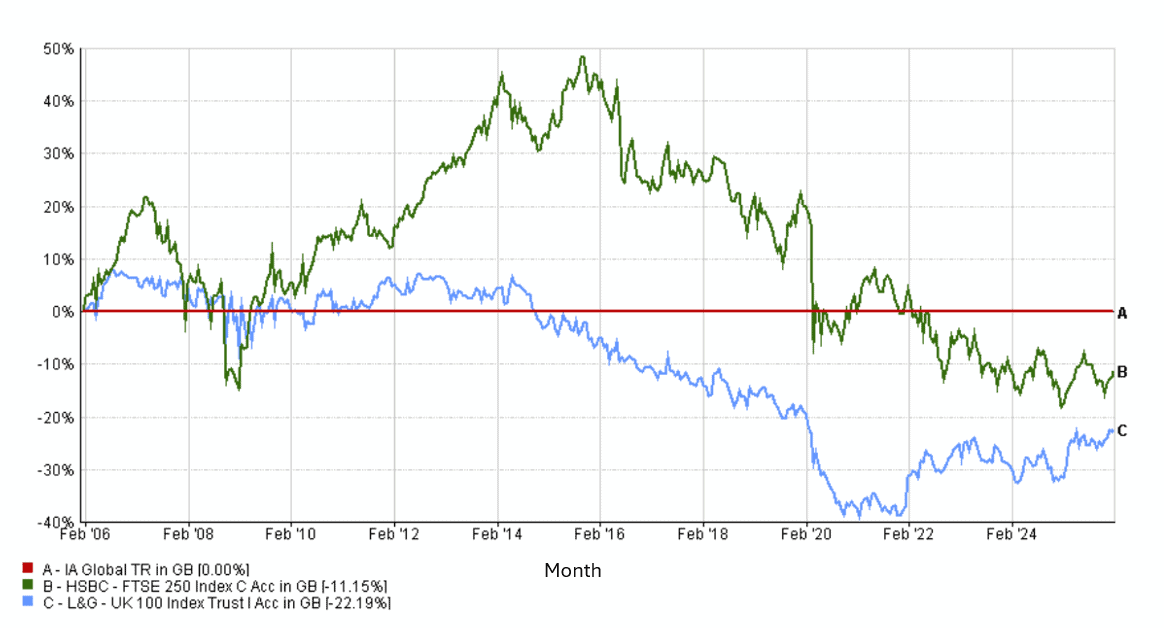
All of the above is backward-looking and therefore factual. The more important question is what happens next. To help frame that, consider the period from 2006 to 2016. This was an excellent decade for active UK managers, with the FTSE 250 outperforming the FTSE 100 by over 150%. Although our current funds were run by different managers at the time, they all beat the FTSE 100, and a FTSE 100 tracker would have ranked in the ninth decile of the IA UK All Companies sector over that period.
Summary
The UK story is very different from the US one, and Asia and Emerging Markets are different again. One of the clearest opportunities for a fund or MPS manager to outperform peers is when tectonic plates begin to shift but the peer group is still driving using the rear-view mirror. Worse still, many cling to deteriorating one, three, and five-year data in the hope that previous market conditions will return.
We are seeing this in the US today, with investors hoping that the last fourteen months of underperformance will reverse. We think the US will continue to struggle, with the best risk-adjusted opportunities further down the market-cap spectrum and more towards value. This raises the risk that the ever-growing pool of money in large S&P tracker funds could face a prolonged period of underperformance.
In the UK, we believe the market overall can continue to perform reasonably well, but that the FTSE 250 may be the engine that powers active managers from here, not just against the FTSE 100 tracker, but against the IA UK All Companies sector as a whole. So, what we need to do is ensure we have the right team of active managers who get where the market is and are not afraid to move away from consensus and backward looking peers, but we will leave how we do that to a future blog.
10 Year Performance of the FTSE 100 & 200 > 19/01/2026 (fig.1)
Source: FE Fundinfo.
3 Year Performance of the IBOSS UK funds > 19/01/2026 (fig.2)
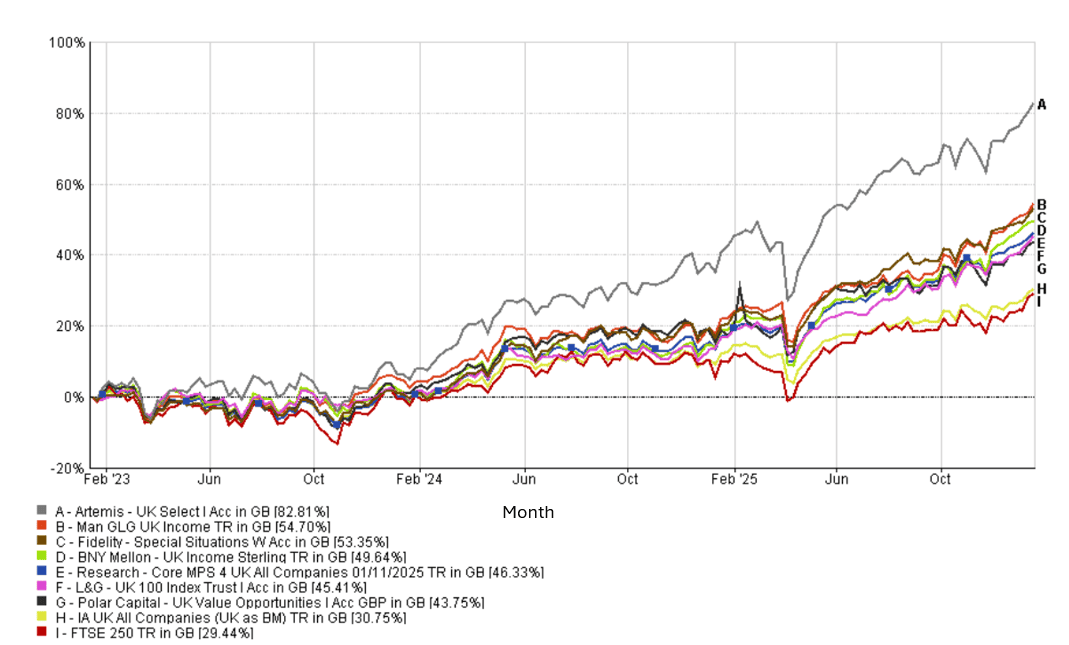
The data presented covers a limited time period due to the context of this metric. Short-term performance may not be indicative of long-term trends. Investors should consider longer-term performance data and other relevant factors before making investment decisions.
Source: FE Fundinfo.
10 Year Performance of the FTSE 100 & 200 – 20/01/2006 > 19/01/2016 (fig.3)

Source: FE Fundinfo.
This communication is designed for professional financial advisers only and is not approved for direct marketing with individual clients. These investments are not suitable for everyone, and you should obtain expert advice from a professional financial adviser. Investments are intended to be held over a medium to long term timescale, taking into account the minimum period of time designated by the risk rating of the particular fund or portfolio, although this does not provide any guarantee that your objectives will be met. Please note that the content is based on the author’s opinion and is not intended as investment advice. It remains the responsibility of the financial adviser to verify the accuracy of the information and assess whether the OEIC fund or discretionary fund management model portfolio is suitable and appropriate for their customer.
Past performance is not a reliable indicator of future performance. The value of investments and the income derived from them can fall as well as rise, and investors may get back less than they invested.
We provide the DFM MPS as both distributor and manufacturer. Details of our target market assessment can be found in our compliance investment procedures, available upon request. Each fund will be assessed independently, but it is highly unlikely that any one fund held in our portfolio will meet the target market in isolation—detail of why the inclusion collectively will be suitable is included within our research. The DFM MPS performance and displayed underlying portfolio charge is produced using the preferred share classes, this may differ from platform to platform and is shown net of fund fees only, they do not incorporate platform costs, adviser’s client fee or DFM service charge.
Data is provided by Financial Express (FE). Care has been taken to ensure that the information is correct but FE neither warrants, neither represents nor guarantees the contents of the information, nor does it accept any responsibility for errors, inaccuracies, omissions or any inconsistencies herein. Please note FE data should only be given to retail clients if the IFA firm has the relevant licence with FE.
IBOSS Asset Management Limited is authorised and regulated by the Financial Conduct Authority. Financial Services Register Number 697866.
IBOSS Asset Management Limited is owned by Mattioli Woods Limited, registered in England and Wales at Companies House, Registered number 3140521.
Registered Office is: 2 Sceptre House, Hornbeam Square North, Harrogate, HG2 8PB. Registered in England No: 6427223.
IAM 23.1.26