
With the announcements of vaccines in the fight against COVID, a jump in the FTSE 100 and a rally in value stocks globally, it’s fair to say Q4 2020 has had it all. Given all that has happened, it is unsurprising that many advisers are fielding questions from their clients. Here are the most frequently asked questions from the last three months, along with the answers that we provided to advisers to aid in their own responses.
“Am I in too many funds? i.e. is my portfolio too diversified.
Why not simply pick the best fund in the class?”
The IBOSS proposition aim has not changed since we launched back in 2008, namely, ‘To beat the relevant benchmark over as many periods as possible, with less than benchmark volatility, lower drawdowns and across all risk ratings’.
Our approach remains evidence-based.
To achieve this, we use multiple funds per geographical or asset class sector; as a result, the portfolios tend to contain more funds than the average multi-asset portfolio. In our opinion, this approach diversifies away from the risk of individual manager decisions. At the same time, it allows us to have tilts such as growth/value without having to commit to one style and hoping we can time the changes in market sentiment. In sectors such as emerging markets, Asia and Europe, we typically hold three funds. Two will be high conviction active managers who have strong track records in producing above benchmark returns and the third will be a passive fund. If we take Europe for example, the passive fund has a natural tilt to value just given the makeup of the European indices (a value stock is a company which trades at a low price relative to factors such as its earnings or sales). The three funds combined have achieved excellent, cost-effective, risk-adjusted results.
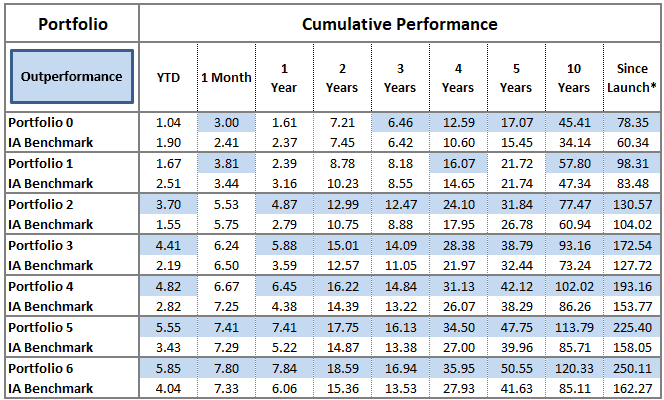
Our investment approach has always had differences to many asset managers; however, our 12-year track record shown in the table below defines whether we have achieved the proposition aims.
MPS Core Range
Data to 30/11/2020
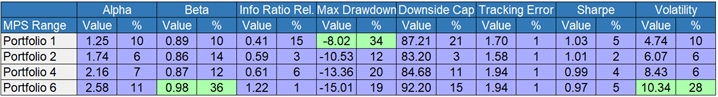
The returns have produced strong risk-adjusted and defensive characteristics. The table below demonstrates a range of ratios since our launch back in November 2008 and ranked within their respective IA Sectors. In each case, the portfolios exhibit top 5 percentile sharpe ratios and close to top decile alpha.
Start of Data Defensive Characteristics
01/11/2008 to 30/11/2020 (Monthly Priced)
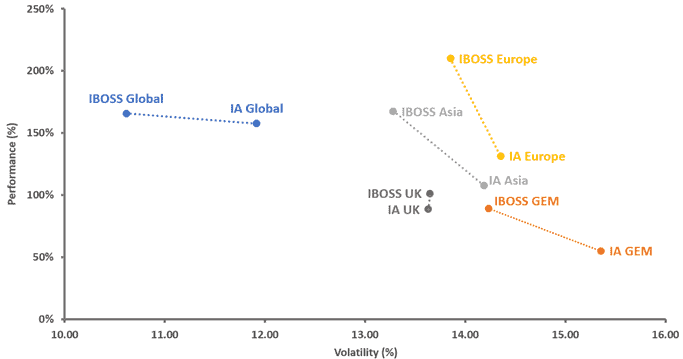
The table below plots our sector performance against volatility for each of Portfolio 4’s equity sectors over ten years. The chart demonstrates how our historical allocation to multiple funds has, in each case, outperformed the sector for a lower level of risk (as measured by volatility). In short, fund selection has contributed meaningfully to performance.
IBOSS Sector Carve out – Performance against Volatility
30/11/2010 – 30/11/2020
Much of our Investment Team’s day-to-day work centres around the blending of different funds and styles. Whilst we expect our managers to produce strong returns over the longer term, we look to make sure their returns are not merely a reflection of the same market conditions.
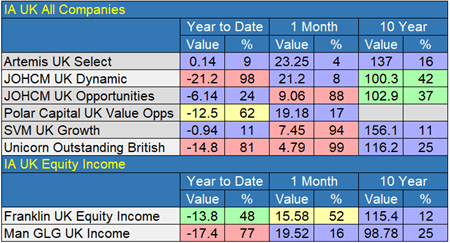
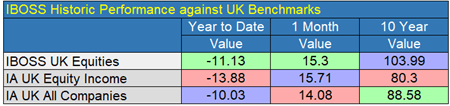
A recent example can be found within UK equities, where funds that performed very well year-to-date have been very different from those that have outperformed in the last month. The below table shows our current UK equity holdings. The table demonstrates strong performance for each fund over the longer term, but the vast dispersion of returns throughout this year. The second table illustrates the historical performance of Portfolio 4’s UK equity holdings, which have outperformed over the longer time frame and performed relatively well in both discrete periods.
UK Equity Holdings in MPS Portfolio 4
Data to 30/11/2020
MPS Portfolio 4 UK Equity Performance
Data to 30/11/2020
“Am I allocated to the right asset classes?
Bonds and equities may be good but is the split between the UK, Asia, Europe and the US the most sensible, especially as the US seems to have been outperforming other markets quite consistently?”
In a similar vein to the points made above, US equities have performed exceptionally well for the past decade, and your portfolio does have a meaningful allocation to US stocks and shares through our international funds (a factor which has contributed to the strong relative returns of the portfolio). Nevertheless, it is worth noting that the US market has been driven higher by a narrowing and concentrated set of companies – Amazon, Facebook, Google etc. These companies already looked expensive pre-COVID; however, the unique characteristics and governmental/public response to the virus was an additional positive factor for these firms. Increased working from home and the high and rapid adoption of technology saw the same basket of companies perform even better and therefore become even more expensive. This was another situation from which many of our funds benefitted.
These same companies may continue to perform well from here; however, we feel it more important than ever to ensure that the portfolios are not overly reliant on a small selection of stocks whose prices are often driven by the same factors. After all, most market fallouts have occurred due to investors investing in an asset and chasing returns which often have already been and gone. As such, we look to make sure that the portfolio has a more diverse equity position. What this means is your portfolio has a significant weighting to areas outside of the US which trade at lower prices relative to history.
To summarize, we currently maintain a meaningful position in the areas of the market that have performed well in the previous decade. Still, we have begun to tilt the portfolio toward the areas of the market that potentially have more upside from here. This includes an increased allocation to UK equities and emerging market equities.
It is worth highlighting that the announcement of the Pfizer COVID vaccine benefitted stocks and geographies, which were “losers” in February, more than the large US technology firms referenced previously. To put this into context, UK equities were up 13% in November against US equity performance of only 8%. This is only short-term data; however, it does highlight how quickly markets can move and the need for diversification within any multi-asset portfolio. It is also worth considering that the US government may be less supportive of these large technology firms in the future, and the continued threat of anti-trust against tech firms now exists globally.
“With inflation likely to accelerate quite soon is there too much in money markets/bonds?”
The sum of bonds in your portfolio is of higher than average quality, and lower than average duration, i.e. less sensitivity to movements in interest rates. In short, these bonds are held for their defensive credentials – a position that helped considerably in the COVID drawdown for equities and high yield (aka junk) bonds. We believe that it will be funds that take significant interest rate risk which could be more vulnerable in an inflationary environment.
We do hold a position in Government bonds, and whilst these have faced headwinds over the past six months they can provide positive returns in falling equity markets as they did in Q4 2018 and Q1 of this year.
Year to Date Fixed Income & MSCI World Equities
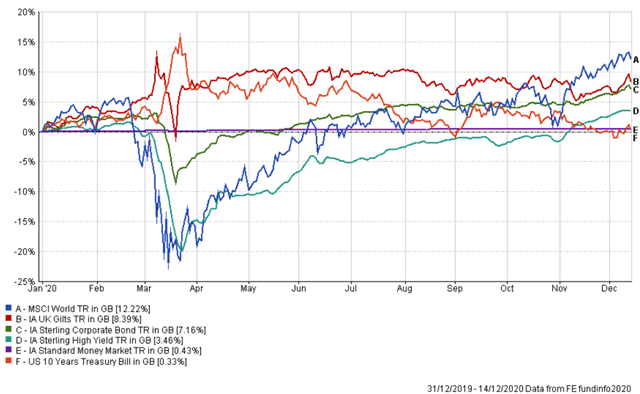
Information displayed is short term in nature to demonstrate performance over a specific time period. Please contact IBOSS for long term data, including since launch and/or 5 years.
“Should we be increasing my portfolio’s exposure to Gold?”
Gold is still trading near an all-time high despite its most recent pullback with the Ninety One fund having rebounded 72% since its March low (data to 15/12/2020). The fund is significantly more volatile than others in your portfolio and we believe the smaller position is still significant enough to make a meaningful impact on overall performance. As an example, the fund has fallen 25% since August (data to 15/12/2020). The Ninety One fund invests in gold (and silver) mining companies, as opposed to the physical metal itself. Although the price over shorter-term can deviate substantially from the underlying gold price, there are sustained periods where the two trade closer together, and other times where the mining fund trades more like other global equities. It is these rare characteristics which gives the fund much of its diversification benefits.
Year to Date Gold/Global Performance
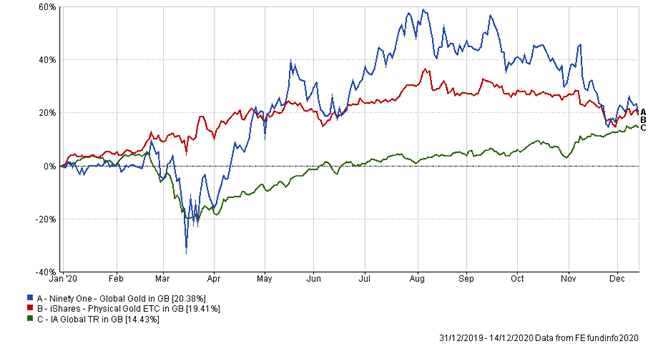
Information displayed is short term in nature to demonstrate performance over a specific time period. Please contact IBOSS for long term data, including since launch and/or 5 years.
This communication is designed for Professional Financial Advisers only and is not approved for direct marketing with individual clients.
Past Performance is no guarantee of future performance. The value of an investment and the income from it can fall as well as rise and investors may get back less than they invested. Risk factors should be taken into account and understood including (but not limited to) currency movements, market risk, liquidity risk, concentration risk, lack of certainty risk, inflation risk, performance risk, local market risk and credit risk.
Data is provided by Financial Express (FE). Care has been taken to ensure that the information is correct but FE neither warrants, neither represents nor guarantees the contents of the information, nor does it accept any responsibility for errors, inaccuracies, omissions or any inconsistencies herein. Please note FE data should only be given to retail clients if the IFA firm has the relevant licence with FE.
IAM 381.12.20