
Markets Soar – January/ February 2026
The first two months of 2026 saw a continuation of the trends that dominated investor portfolios throughout 2025, with the rest of the world increasingly viewing the US as having at least as many economic and political challenges as other regions under President Trump.
As a result, investors have increasingly allocated away from the US, either by hedging their exposure to the dollar or by directly investing in other markets globally. This trend was so dominant that by the end of February the rest of the world had outperformed the US by a record 9.5%. In fact, an investor holding US equities over this period would have seen negative returns after costs, compared with double digit gains in Emerging Markets, the UK and Japan.
It was not only equities that performed well. We also saw excellent returns from several alternative assets. This included gold and commodities, which we have discussed extensively in recent updates, as well as property and infrastructure. The latter saw particularly strong performance, with double digit gains in February alone as the dual prospect of interest rate cuts and the attraction of holding hard or real assets became increasingly compelling.
Indeed, the idea of holding broader real assets has recently produced a new investment acronym. This time it is not another variation of the FAANG or Magnificent Seven themes. The acronym is HALO, which stands for Heavy Assets, Low Obsolescence. The concept refers to companies whose value is tied to large physical assets that are unlikely to become obsolete quickly, even in a world of rapid technological change and artificial intelligence.
This represents a notable shift from only a few years ago and reflects the pace of progress being made in AI. This was illustrated clearly in markets when many software as a service (SaaS) companies saw their share prices fall sharply following a demonstration of an AI agent capable of performing complex business tasks autonomously rather than simply answering questions.
The concern from investors was that these AI agents could replace many individual SaaS applications by creating software or completing workflows themselves without the need for the application. Whether this proves accurate remains to be seen. However, the market reaction demonstrated how sensitive some industries can be to sudden developments, with software and services companies losing roughly $1 trillion in market value within a matter of days.
Many of these businesses have since recovered some ground and the sell off may ultimately present opportunities for long term investors. Nevertheless, it demonstrates the importance of diversification across industries, sectors and funds. A number of traditionally stable “buy and hold” growth funds struggled significantly as many of their core holdings suddenly appeared exposed to technological disruption.
Markets Sour – March 2026
Despite a great deal continuing to happen beneath the surface of markets, with many of the longer-term drivers of disruption and volatility still firmly in place, the start of March saw investors’ attention turn to the unfolding situation in Iran.
The human dimension of conflict is profound and deeply tragic, and our thoughts are with all those affected. However, from an investment perspective we must inevitably focus on how such events influence markets, sentiment and the broader economic outlook.
The majority of investable assets have declined in sterling terms during March. In equity markets, all major indices are currently in negative territory for the month. The relatively better performers have been China (-1.07%) and the United States (-2.08%), while the more heavily impacted regions have been Japan (-8.35%) and Europe (-7.75%).
This pattern is perhaps unsurprising given that the most significant shock to markets has been the disruption to shipping through the Strait of Hormuz, a critical energy corridor through which roughly 20% of the world’s oil supply normally passes. The conflict has severely restricted flows through the strait, pushing energy prices higher and creating significant uncertainty in global energy markets.
Countries and regions that are more reliant on imported energy have therefore borne the brunt of the market reaction. Japan, for example, imports the vast majority of its energy and sources a very large share of its oil from the Middle East, making it particularly vulnerable to disruptions in the Gulf. Europe also remains dependent on imported energy, including liquefied natural gas shipped from Qatar through the same route.
By contrast, the United States benefits from substantial domestic oil production, while China has diversified its energy mix significantly over the past decade by rapidly expanding renewable generation and building large strategic energy reserves. These factors have helped buffer both economies somewhat from the immediate shock.
Interestingly, the crisis has also reignited debate around energy policy in Europe. Ursula von der Leyen recently acknowledged that Germany’s decision to close its nuclear power stations may, in retrospect, have been a strategic mistake, particularly given the continent’s ongoing energy security challenges.
As with the SaaS situation discussed earlier, this episode also demonstrates how quickly market narratives can shift and reinforces the importance of diversification. Prior to March the rhetoric around markets often painted the United States as something of a pariah. However, these specific circumstances have proved supportive for the US dollar, which has been viewed as a haven asset given the country’s relative insulation from the conflict and the impact of higher energy prices.
Markets Surprise – (?)
This may read as dour at first, but historically geopolitical conflict has had only a short-lived effect on markets. Earlier this year, we issued a note to advisers titled “Why Stay Invested”, which reminded investors of some classic but important principles, including the value of time in the market versus timing the market and the fact that the best days often follow the worst. These lessons may feel trite amid the current uncertainty, but they have endured for a reason. Even during the recent pullback, we have already seen positive market days. Notably, the South Korean market fell roughly 12% in a single session before rebounding almost 10% the next day, marking both the largest daily loss and gain on record.
While short-term shocks dominate headlines, the market conditions that began in 2025 appear more structural in nature. AI will continue to have unpredictable impacts on industries and regions, and global sentiment toward US assets remains cautious, perhaps even more so following the recent conflict. For context, Figure 1 illustrates equity returns from 2025 to date, comparing the US with the rest of the world.
Figure 1: Global Equity Performance 2025 to date
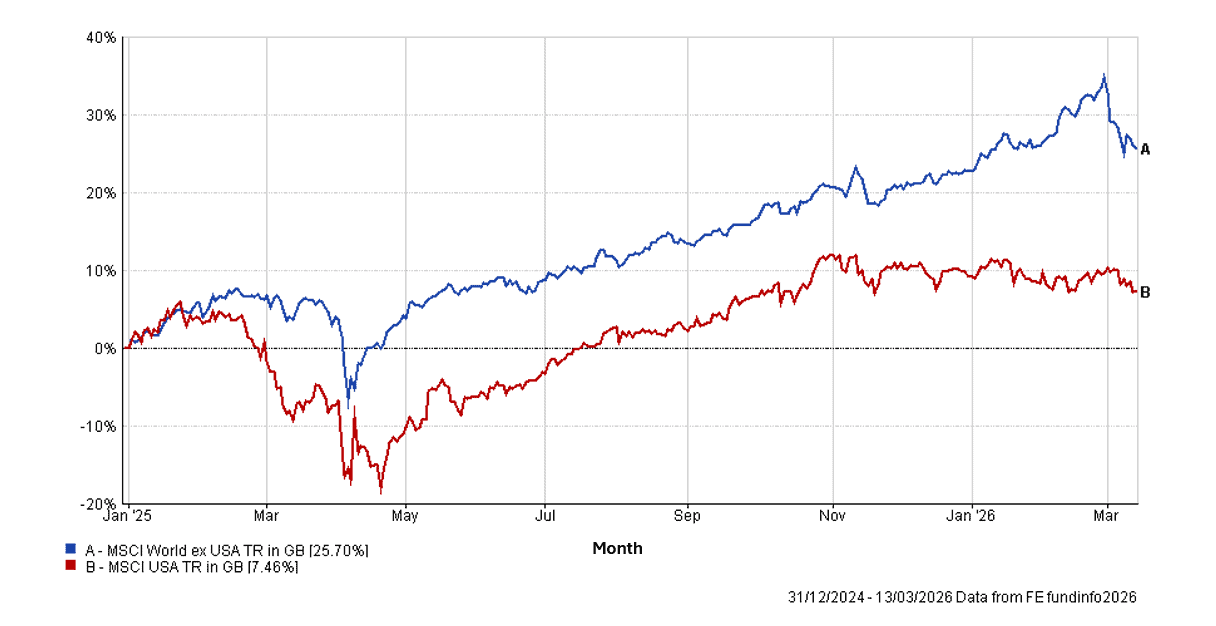
The data presented covers a limited time period due to the context of this metric. Short-term performance may not be indicative of long-term trends. Investors should consider longer-term performance data and other relevant factors before making investment decisions.
Another area beginning to attract greater scrutiny, though currently receiving relatively little media attention due to the focus on Iran, is the private markets space, particularly private credit and private equity. These asset classes have grown rapidly over the past decade as investors sought higher yields and exposure to emerging opportunities. However, recent market disruptions, combined with underlying liquidity constraints, have highlighted the potential risks. Some investors have struggled to access their capital in a timely manner, underscoring the fact that these assets are inherently less liquid than public equities or bonds. In the event of a broader market shock, there is potential for stress in private markets to spill over into more liquid parts of the bond and equity markets, making careful portfolio construction and attention to liquidity risk ever more important.
Diversification is the only free lunch in investing
Investors are quickly learning that in current markets there is no easy one-size-fits-all diversifying asset. Gold is up 18% this year but fell 4% from the start of March as the conflict in Iran kicked off. The US dollar acted as a safe haven through March but has been a significant headwind since 2025. HALO assets like property protected investors during the SaaS sell-off but struggled as inflation expectations surged. Fixed income may provide protection during a recession but face the prospect of inflation and private credit spillover.
In this environment, it is more important than ever to hold a portfolio with a variety of assets and avoid concentration. Diversification not only makes portfolios more robust to downside shocks but also opens the door to a wider range of opportunities on the upside. Volatility can feel uncomfortable, but these periods often provide the best opportunities for flexible investors to deploy capital effectively.
We have met with several fund managers over the past few weeks, and the majority view the recent market pullback as a strong opportunity to invest after a very strong start to the year. It is also worth noting that, despite recent turbulence, markets are still significantly up year-to-date.
IBOSS Performance Update to February 28th 2026
All IBOSS portfolios across all MPS ranges outperformed their respective IA benchmarks in February 2026, delivering returns between 2.2% and 5.5% for the month. Figure 2 shows the performance of IBOSS Core 4 versus previous years. While this chart does not reflect the recent market pullback, it highlights that 2026 has so far produced one of the strongest starts to a year on record relative to its benchmark.
Figure 2: Calendar Year Excess Return – IBOSS Core 4 against IA Benchmark
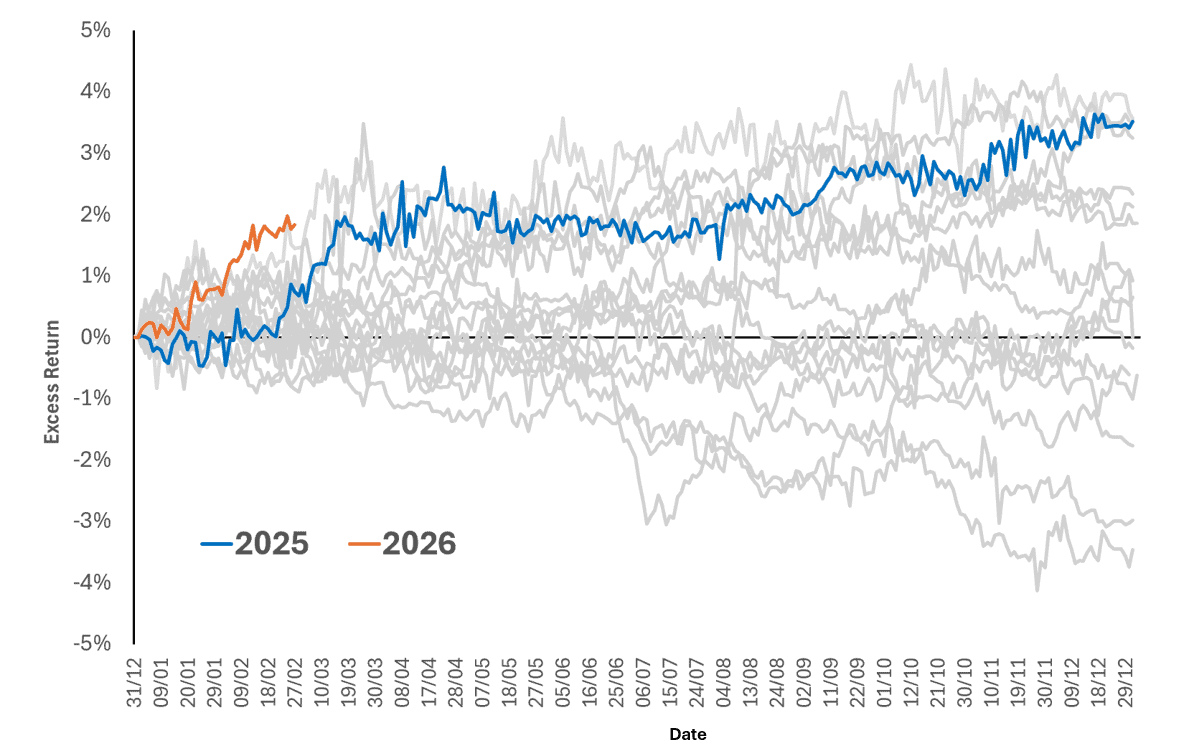
Source: FE Fundinfo
The data presented covers a limited time period due to the context of this metric. Short-term performance may not be indicative of long-term trends. Investors should consider longer-term performance data and other relevant factors before making investment decisions.
Equity positioning has been a key contributor to returns year-to-date, as US assets have underperformed relative to a broader global allocation, as illustrated in Figure 3. Notably, this remains the case even including the pullback in March.
Figure 3: Year to Date Equity Performance
The data presented covers a limited time period due to the context of this metric. Short-term performance may not be indicative of long-term trends. Investors should consider longer-term performance data and other relevant factors before making investment decisions.
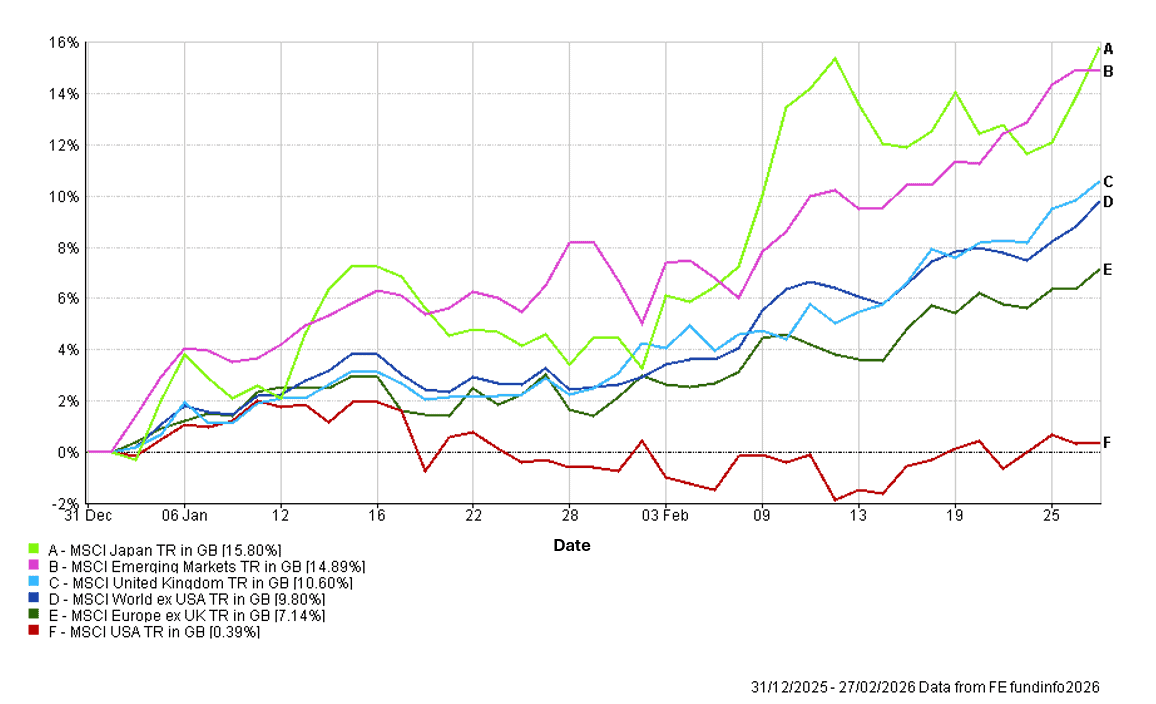
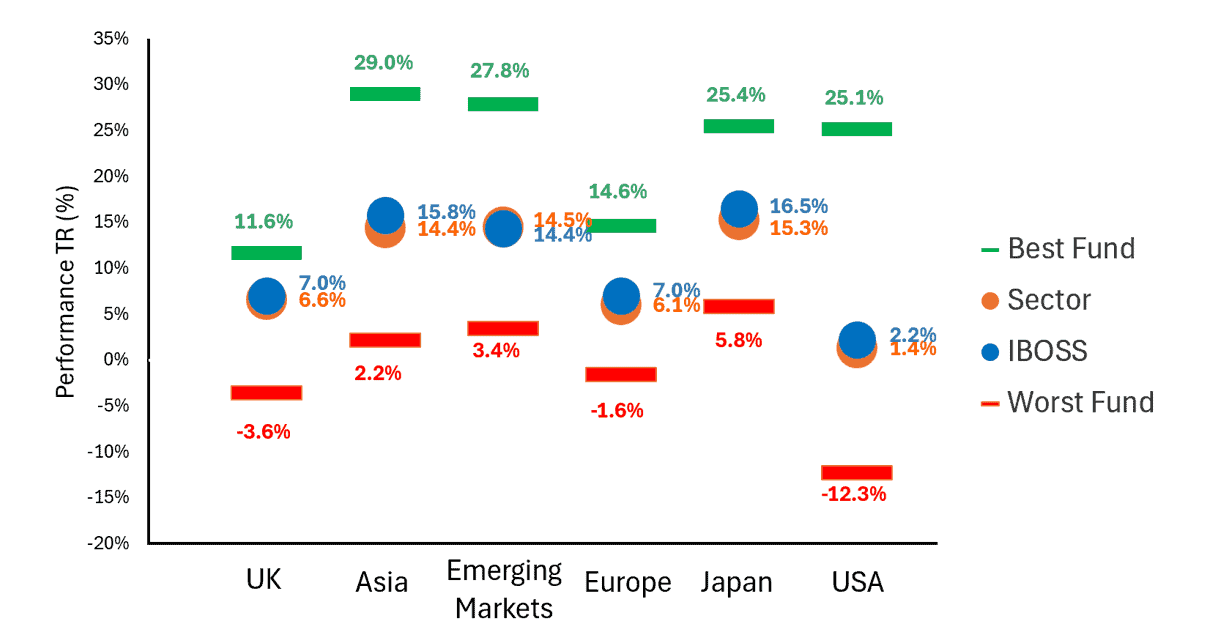
Last year we highlighted the growing importance of fund selection, as dispersion between top- and bottom-performing funds widened. A similar trend is evident this year, particularly in the US, where SaaS stocks struggled amid AI developments. Figure 4 shows that our approach of holding a broader range of funds has delivered strong equity returns across multiple sectors, helping portfolios navigate periods of heightened volatility. The combination of positive asset allocation and fund selection has driven outperformance across the ranges.
Figure 4: Equity Attribution Analysis – Fund Selection in 2026 to 28/02/2026
Source: FE Fundinfo
The data presented covers a limited time period due to the context of this metric. Short-term performance may not be indicative of long-term trends. Investors should consider longer-term performance data and other relevant factors before making investment decisions.
It is worth noting that the commentary above is up to the 28th February, and markets have moved some what since. Please do get in contact if you require updated performance figures or comments. At time of writing the portfolios have performed largely in line with the benchmark through March.
This communication is designed for professional financial advisers only and is not approved for direct marketing with individual clients. These investments are not suitable for everyone, and you should obtain expert advice from a professional financial adviser. Investments are intended to be held over a medium to long term timescale, taking into account the minimum period of time designated by the risk rating of the particular fund or portfolio, although this does not provide any guarantee that your objectives will be met. Please note that the content is based on the author’s opinion and is not intended as investment advice. It remains the responsibility of the financial adviser to verify the accuracy of the information and assess whether the OEIC fund or discretionary fund management model portfolio is suitable and appropriate for their customer.
Past performance is not a reliable indicator of future performance. The value of investments and the income derived from them can fall as well as rise, and investors may get back less than they invested.
We provide the DFM MPS as both distributor and manufacturer. Details of our target market assessment can be found in our compliance investment procedures, available upon request. Each fund will be assessed independently, but it is highly unlikely that any one fund held in our portfolio will meet the target market in isolation—detail of why the inclusion collectively will be suitable is included within our research. The DFM MPS performance and displayed underlying portfolio charge is produced using the preferred share classes, this may differ from platform to platform and is shown net of fund fees only, they do not incorporate platform costs, adviser’s client fee or DFM service charge.
Data is provided by Financial Express (FE). Care has been taken to ensure that the information is correct but FE neither warrants, neither represents nor guarantees the contents of the information, nor does it accept any responsibility for errors, inaccuracies, omissions or any inconsistencies herein. Please note FE data should only be given to retail clients if the IFA firm has the relevant licence with FE.
IBOSS Asset Management Limited is authorised and regulated by the Financial Conduct Authority. Financial Services Register Number 697866.
IBOSS Asset Management Limited is owned by Mattioli Woods Limited, registered in England and Wales at Companies House, Registered number 3140521.
Registered Office is: 2 Sceptre House, Hornbeam Square North, Harrogate, HG2 8PB. Registered in England No: 6427223.
IAM 85.3.26