

Equity Overview
The valuations of global equities have changed dramatically since the start of the year following coronavirus drawdown. The chart below demonstrates the Cyclically Adjusted Price Earnings (CAPE) ratio for major economies across the world, and every economy has taken a significant leg down. This does not however mean, in our opinion, that markets look cheap overall. In fact, areas such as the US look to be more expensive than ever on a relative valuation basis. It does though mean that many areas look to be better value for selective managers and investors. It is this selectivity that is perhaps more important than ever as global equity indices are increasingly weighted to very few stocks and markets, all of which look expensive on most metrics. The MSCI World currently has a 66% weighting in US equities and a 20% weighting in US internet stocks which consist almost entirely of 6 names – Facebook, Apple, Amazon, Alphabet, Netflix and Microsoft.
Market Valuations – Global Equity Cyclically Adjusted Price Earnings to 31/01/2020
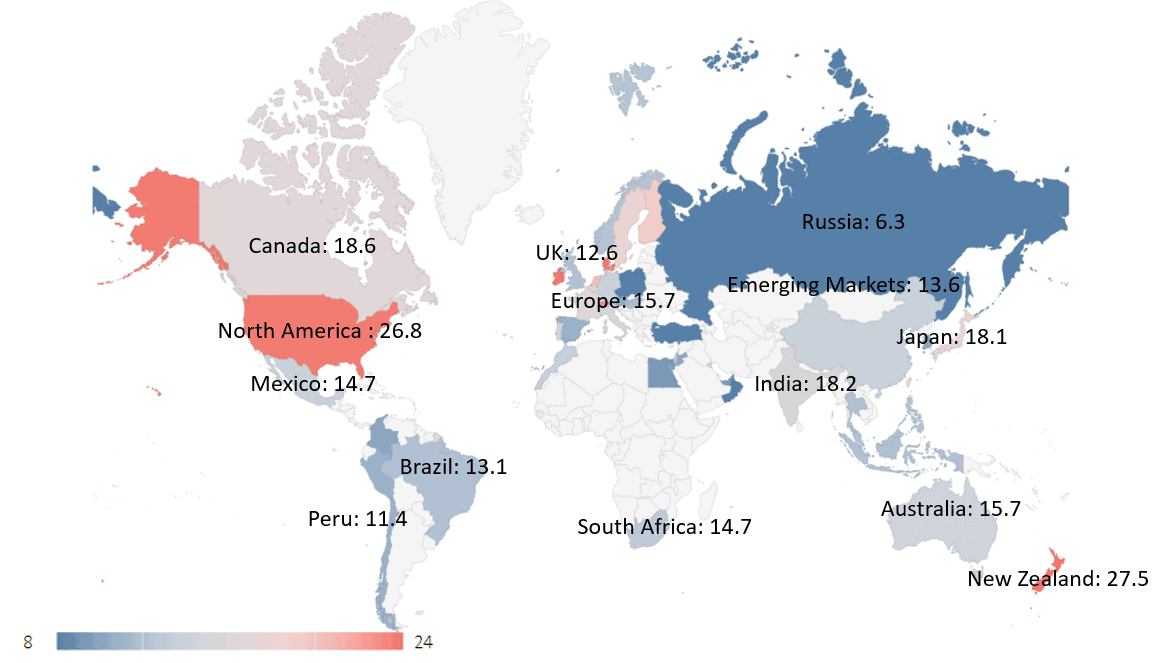
Source: STAR Capital
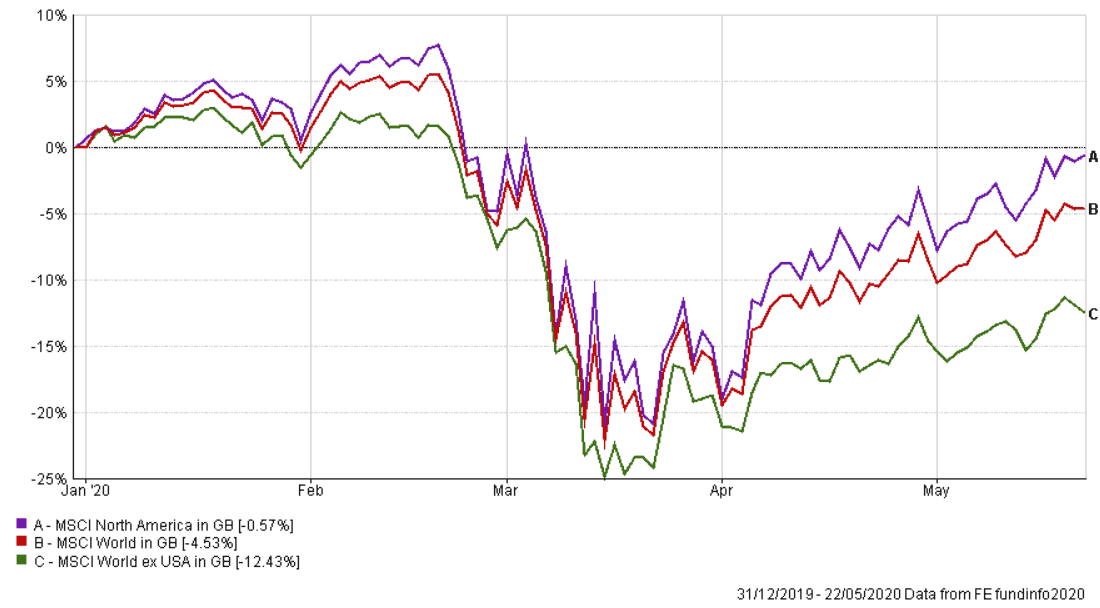
In certain respects, the CAPE world map above does not reflect the whole picture. The reversal in market fortunes since the 22nd of March has been both pronounced and sharp. The commentary surrounding a ‘V’ shaped sell off and rebound are hard to avoid, however, it is worth considering just how sharply some equity markets have recovered against a backdrop of pretty dire economic conditions.
The chart below demonstrates the scale of the market rebound. US Equities have been the largest beneficiary, trading back to levels last seen at the beginning of the year, and powered by a combination of internet, healthcare, and growth stocks; all of which have been the biggest recipients of investment in lockdown conditions. Whether they continue to outperform from here we do not know, but there is a risk that they could see significant headwinds as lockdowns are eased and basically the tailwinds become something of a headwind.
Equity Market Retracement
IBOSS Position
The below comments outline some of the equity overweight and underweight positions in the IBOSS ranges. However, it is important to note that these are relative positions and a key principle in the construction of IBOSS portfolios, and their asset allocation, is a focus on diversification. What this means in reality is that we are unlikely to take large asset allocation decisions based on geography and sector, but rather tilt the portfolios toward areas of perceived opportunity and away from those of perceived price vulnerability.
We would also note that despite what we consider to be opportunities in the areas below over the longer term, we still expect there to be further periods of extreme volatility, as seen in February. For this reason, we continue to work to ensure that our portfolios are as diversified as we can and across risk assets. This currently includes an overweight position in Cash/ Money market instruments and short dated corporate bond funds, both positions that we believe should reduce volatility in periods of market stress.
Relative Overweight positions
UK Equities continue to trade, on average, at lower valuations relative to the wider market. The combination of political disruption and greater structural sensitivity to the coronavirus impact have acted as significant headwinds over recent times. However, pre coronavirus and post the election of Boris Johnson, the outlook for UK equities had picked up significantly as uncertainty was at least partially diminished. Whilst this narrative has, so far, been side-lined in favour of the coronavirus narrative it is still worth considering that the general election has ironically given the UK one of the strongest governments in Europe.
The combination of improved political clarity and relatively low valuations leave us to conclude that there are significant opportunities for active UK managers. This is unlikely to be straightforward, and there will undoubtedly be winners and losers. Our emphasis remains focused on trying to select UK management teams with the experience and demonstrable ability to select companies that can weather the short-term headwinds and capitalise on the increased opportunity set.
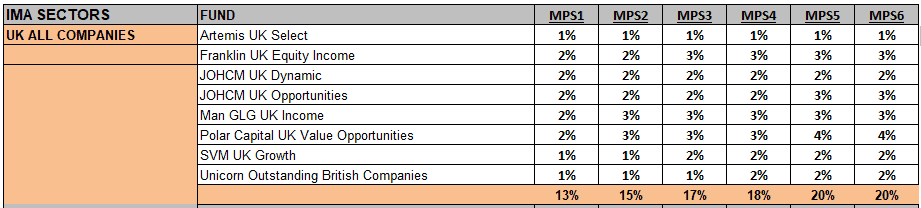
Current UK All Companies funds
Global Emerging Markets
Much like our previous comments, the valuation of many emerging markets looks to be attractive relative to many global developed equity markets. It is worth considering that the countries that make up emerging markets are extremely varied and diverse in nature. What this means is that different economic conditions can affect countries and the companies operating in them very differently from region to region. We would therefore prefer to hold a variety of active fund managers who can actively allocate to areas of emerging markets where they see the most opportunities, and a global emerging markets tracker to give us more broad based exposure to emerging markets.
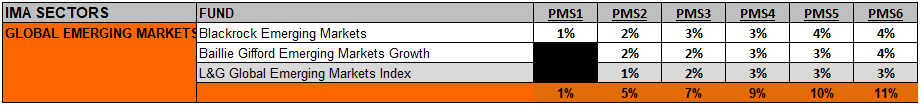
Current UK All Companies funds
Relative Underweight positions
Whilst we still have a sizable position in US Equities, we are underweight in the geography relative to our respective benchmarks. As mentioned previously, our concern here is that many investors with a global remit already have a significant allocation to US equities. Though the US could continue to perform well from here on the back of central bank and economic stimulus, we believe markets in the US still look very expensive. Additionally, there is an increased degree of concentration risk in US assets which are very heavily weighted to the well-known internet stocks.
This communication is designed for Professional Financial Advisers only and is not approved for direct marketing with individual clients.
Past Performance is no guarantee of future performance. The value of an investment and the income from it can fall as well as rise and investors may get back less than they invested.
Risk factors should be taken into account and understood including (but not limited to) currency movements, market risk, liquidity risk, concentration risk, lack of certainty risk, inflation risk, performance risk, local market risk and credit risk.
Data is provided by Financial Express (FE). Care has been taken to ensure that the information is correct but FE neither warrants, neither represents nor guarantees the contents of the information, nor does it accept any responsibility for errors, inaccuracies, omissions or any inconsistencies herein. Please note FE data should only be given to retail clients if the IFA firm has the relevant licence with FE.