

When does correlation really matter?
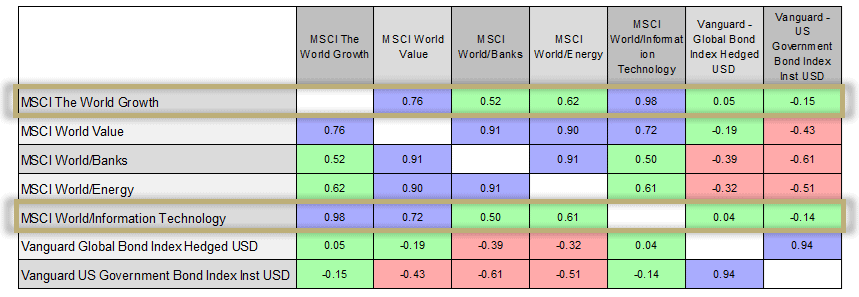
The highest correlation in the table (fig.1) is the MSCI World/Information Technology Index and the MSCI World Growth Index; in fact, they are almost perfectly correlated. The least correlated asset class in this group against the MSCI World/Information Technology Index is the US Government Bond Index.
One portfolio construct that has worked well over the last few years then is a combination of long sovereign bonds and an overweight to technology, and if that’s all held in the US, well, that’s been just fine too. With the exceptions of brief periods such as Q4 2018, these joint bets, both of which are premised on low-interest rates, maximum liquidity and relentless jawboning to calm the markets on any dips, have worked spectacularly well.
2 Year Correlation Table (Total Return In GB) (Fig.1)*
The hidden risks
The issue for asset allocators, and almost anybody who is trying to construct genuinely diversified portfolios, is any attempt at diversification over the last few years away from long tech (growth) and virtually every kind of long bond, has been alpha destructive.
It is understandable that market participants want to feel good about their positioning, but anything other than super bullish growth and bonds still feels like an uncomfortable position. Keen market observers, who watch the effect of data and central bank announcements on risk assets, can see the current correlations play out in real-time.
A recent disappointing US jobs report took treasury yields back down to lows not seen since the end of January, which was a time of elevated virus concerns. At the same time, the tech heavy Nasdaq was the best performing US index. The reason and outcome were the same as they have been for years; bad jobs number means more stimulus and/or lower for longer interest rates. An hour after that jobs data came out, we had a positive surprise in a blowout ISM Non-Manufacturing PMI, and all positions quickly reversed.
So, there is a real risk to assets whose valuation is predicated on a super low global interest rate policy, and when tech (growth) sells off, it will likely take sovereigns with it. If the US economy does continue to shine, this paradoxically could be bad for some risk assets like tech but good for others such as energy and banks.
What we don’t know is just as important as what we do
The first point we would make is, that there is no playbook for economies or markets coming out of a global pandemic with massive amounts of stimulus supporting them. There is an unlimited amount of market opinion out there, often backed up with references to previous decades, but the truth is that no previous situation is like the present one.
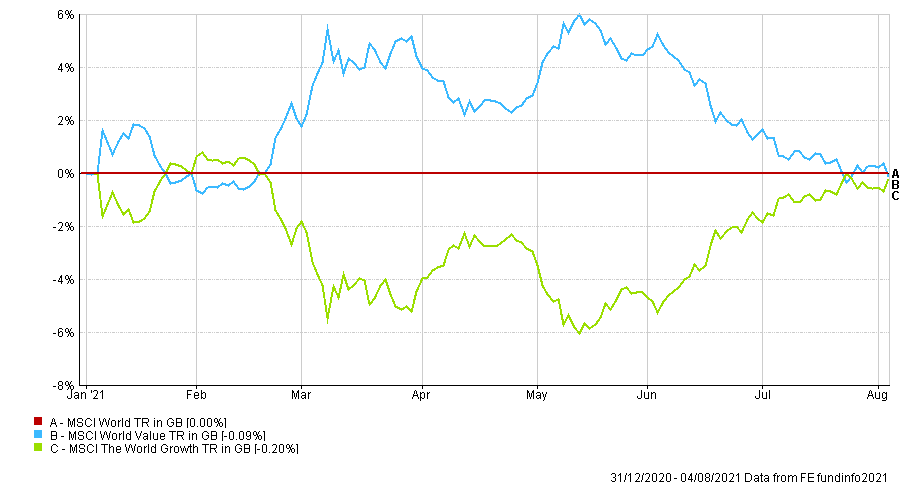
The second point is, that even if we knew what would happen, we still wouldn’t know either when or the magnitude of the effects of withdrawing stimulus. The updated chart below (fig.2) highlights the market reaction to the ‘growth versus value’ dichotomy year to date, which could be loosely labelled ‘tech versus non-Tech’.
Our conclusion remains the same as it has for some months now; the factors driving market performance are in a state of flux. Crucially, the risks to multi-asset portfolios are exacerbated by an overweight to correlated assets, as we have described above. In our view, there is a misleading sense of protection based on a barbell of sovereigns and growth stocks. While sovereigns may well give security in the immediate downdraft of an equity fall, they only offer good long-term value if you think the world economies, especially the US, never get back on track. We don’t know for sure the answer to that question, but we feel there is every chance economies will rebound, and central banks will have an even more difficult path to tread.
We have built our investments predicated on diversification, relative valuations, current correlations and an acceptance of what it is not possible to know.
Growth Versus Value Relative To The MSCI World Index Year To Date (Fig.2)*
*Information displayed is short term in nature to demonstrate performance over a specific time period. Please contact IBOSS for long term data, including since launch and/or 5 years.
This communication is designed for Professional Financial Advisers only and is not approved for direct marketing with individual clients. It does not purport to be all-inclusive or contain all of the information which a proposed investor may require in order to make a decision as to whether to invest or not. Nothing in this document constitutes a recommendation suitable or appropriate to a recipient’s individual circumstances or otherwise constitutes a personal recommendation.
Past Performance is no guarantee of future performance. The value of an investment and the income from it can fall as well as rise and investors may get back less than they invested. Risk factors should be taken into account and understood including (but not limited to) currency movements, market risk, liquidity risk, concentration risk, lack of certainty risk, inflation risk, performance risk, local market risk and credit risk.
Data is provided by Financial Express (FE). Care has been taken to ensure that the information is correct but FE neither warrants, neither represents nor guarantees the contents of the information, nor does it accept any responsibility for errors, inaccuracies, omissions or any inconsistencies herein. Please note FE data should only be given to retail clients if the IFA firm has the relevant licence with FE.
IAM 258.8.21